Riga Mobility Metrics
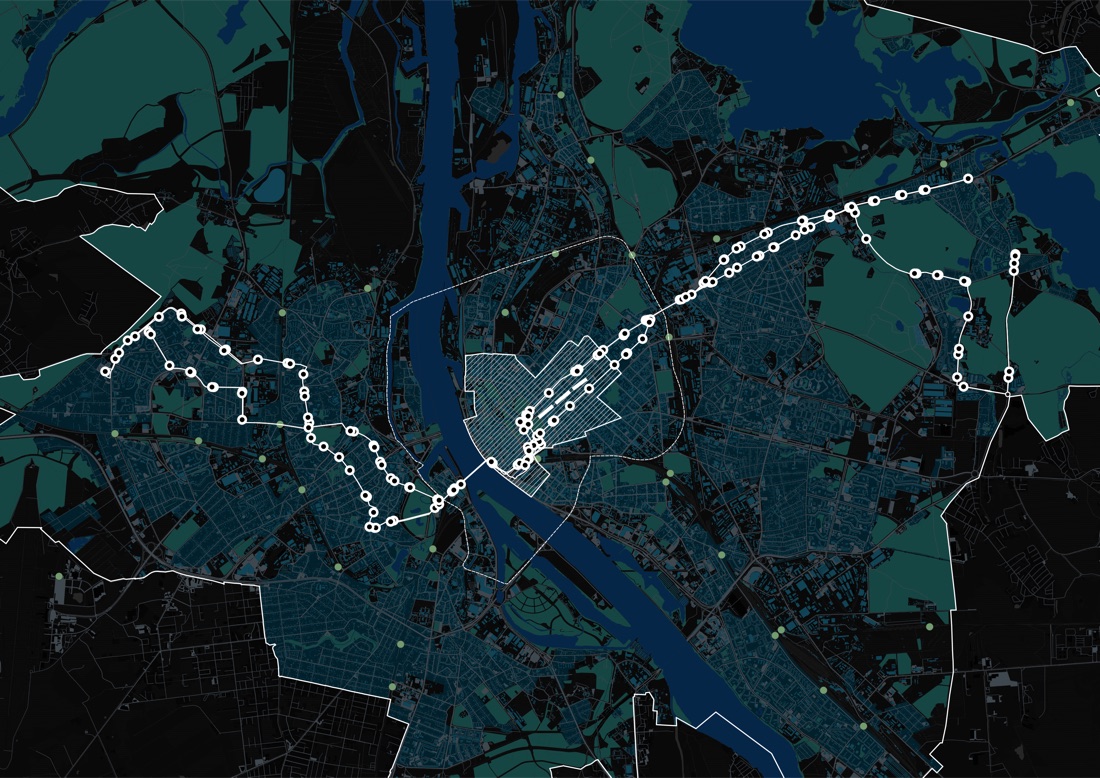
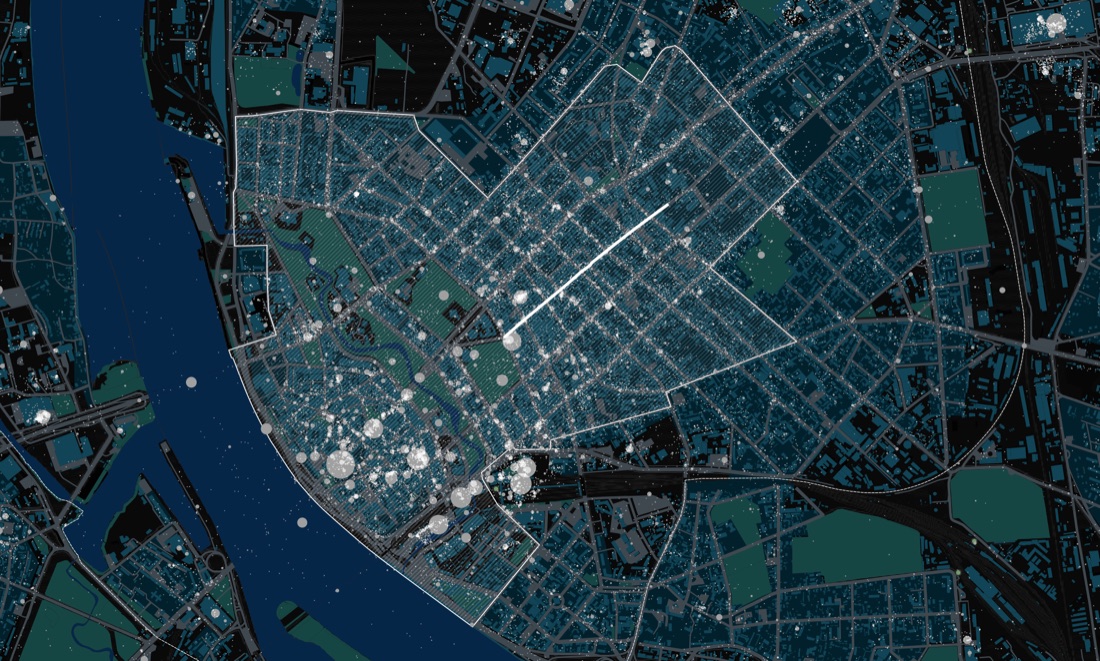
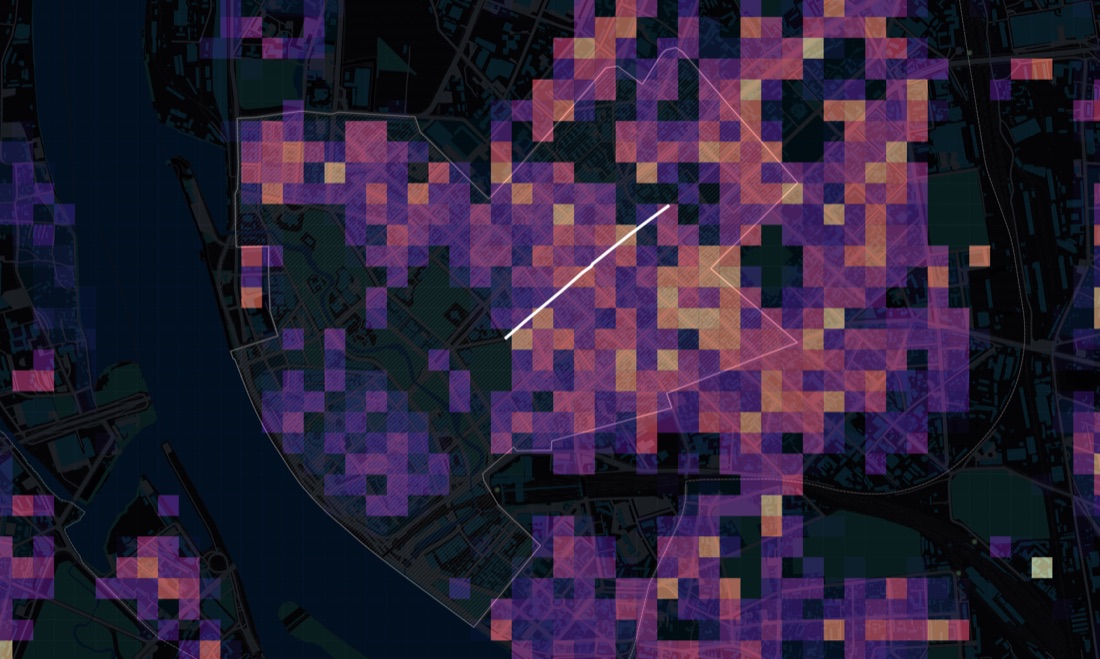
Mapping how far Riga’s public transport actually reaches — and testing one specific street, Tērbatas iela, as a case study for what better transit access could unlock.
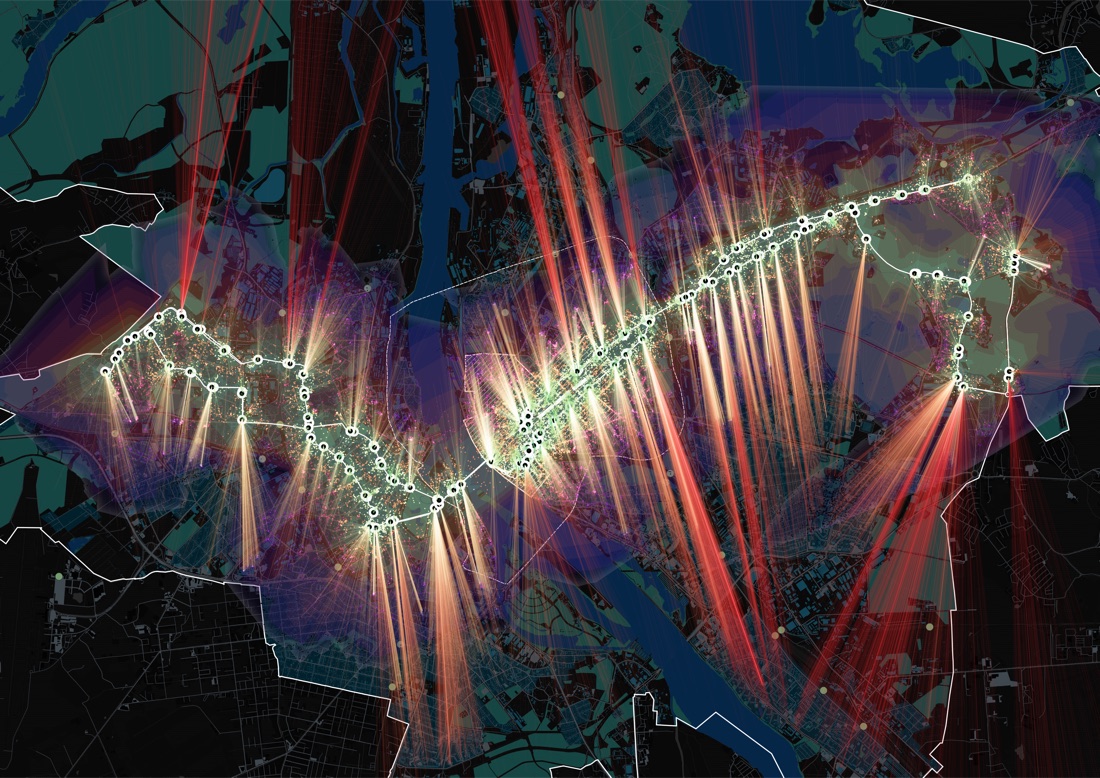
Understanding a transit network on paper is different from understanding how far it actually reaches people and places. This study combined ridership, population, and social-media activity data to measure Riga’s public transport catchment in concrete terms.
Commissioned by Demos Helsinki, comparing conditions in 2018 and 2020, and benchmarked against the European Commission’s official Sustainable Urban Mobility Indicators (SUMI) framework. A specific street, Tērbatas iela, received its own dedicated case-study analysis — the reasoning for that focus isn’t accessible in the currently synced files.
Combined the full Rīgas Satiksme GTFS transit feed, smart-card validation (ridership) data, Latvia’s official 100m population grid, and Foursquare check-in data classified through SPIN Unit’s necessary/optional activity framework — measuring how population and activity fall off with distance from transit stops, in 300m increments out to 3km.
Gave Demos Helsinki a quantified picture of how well Riga’s transit network actually serves its population and its most active places — with Tērbatas iela singled out as a specific case for deeper study.