SPIN Unit is an urban research practice of urbanists, data analysts and policy researchers in Helsinki and Tallinn. Since 2012 we have studied how places are built, used and valued. We also review public policies and design policy blueprints and scenarios.
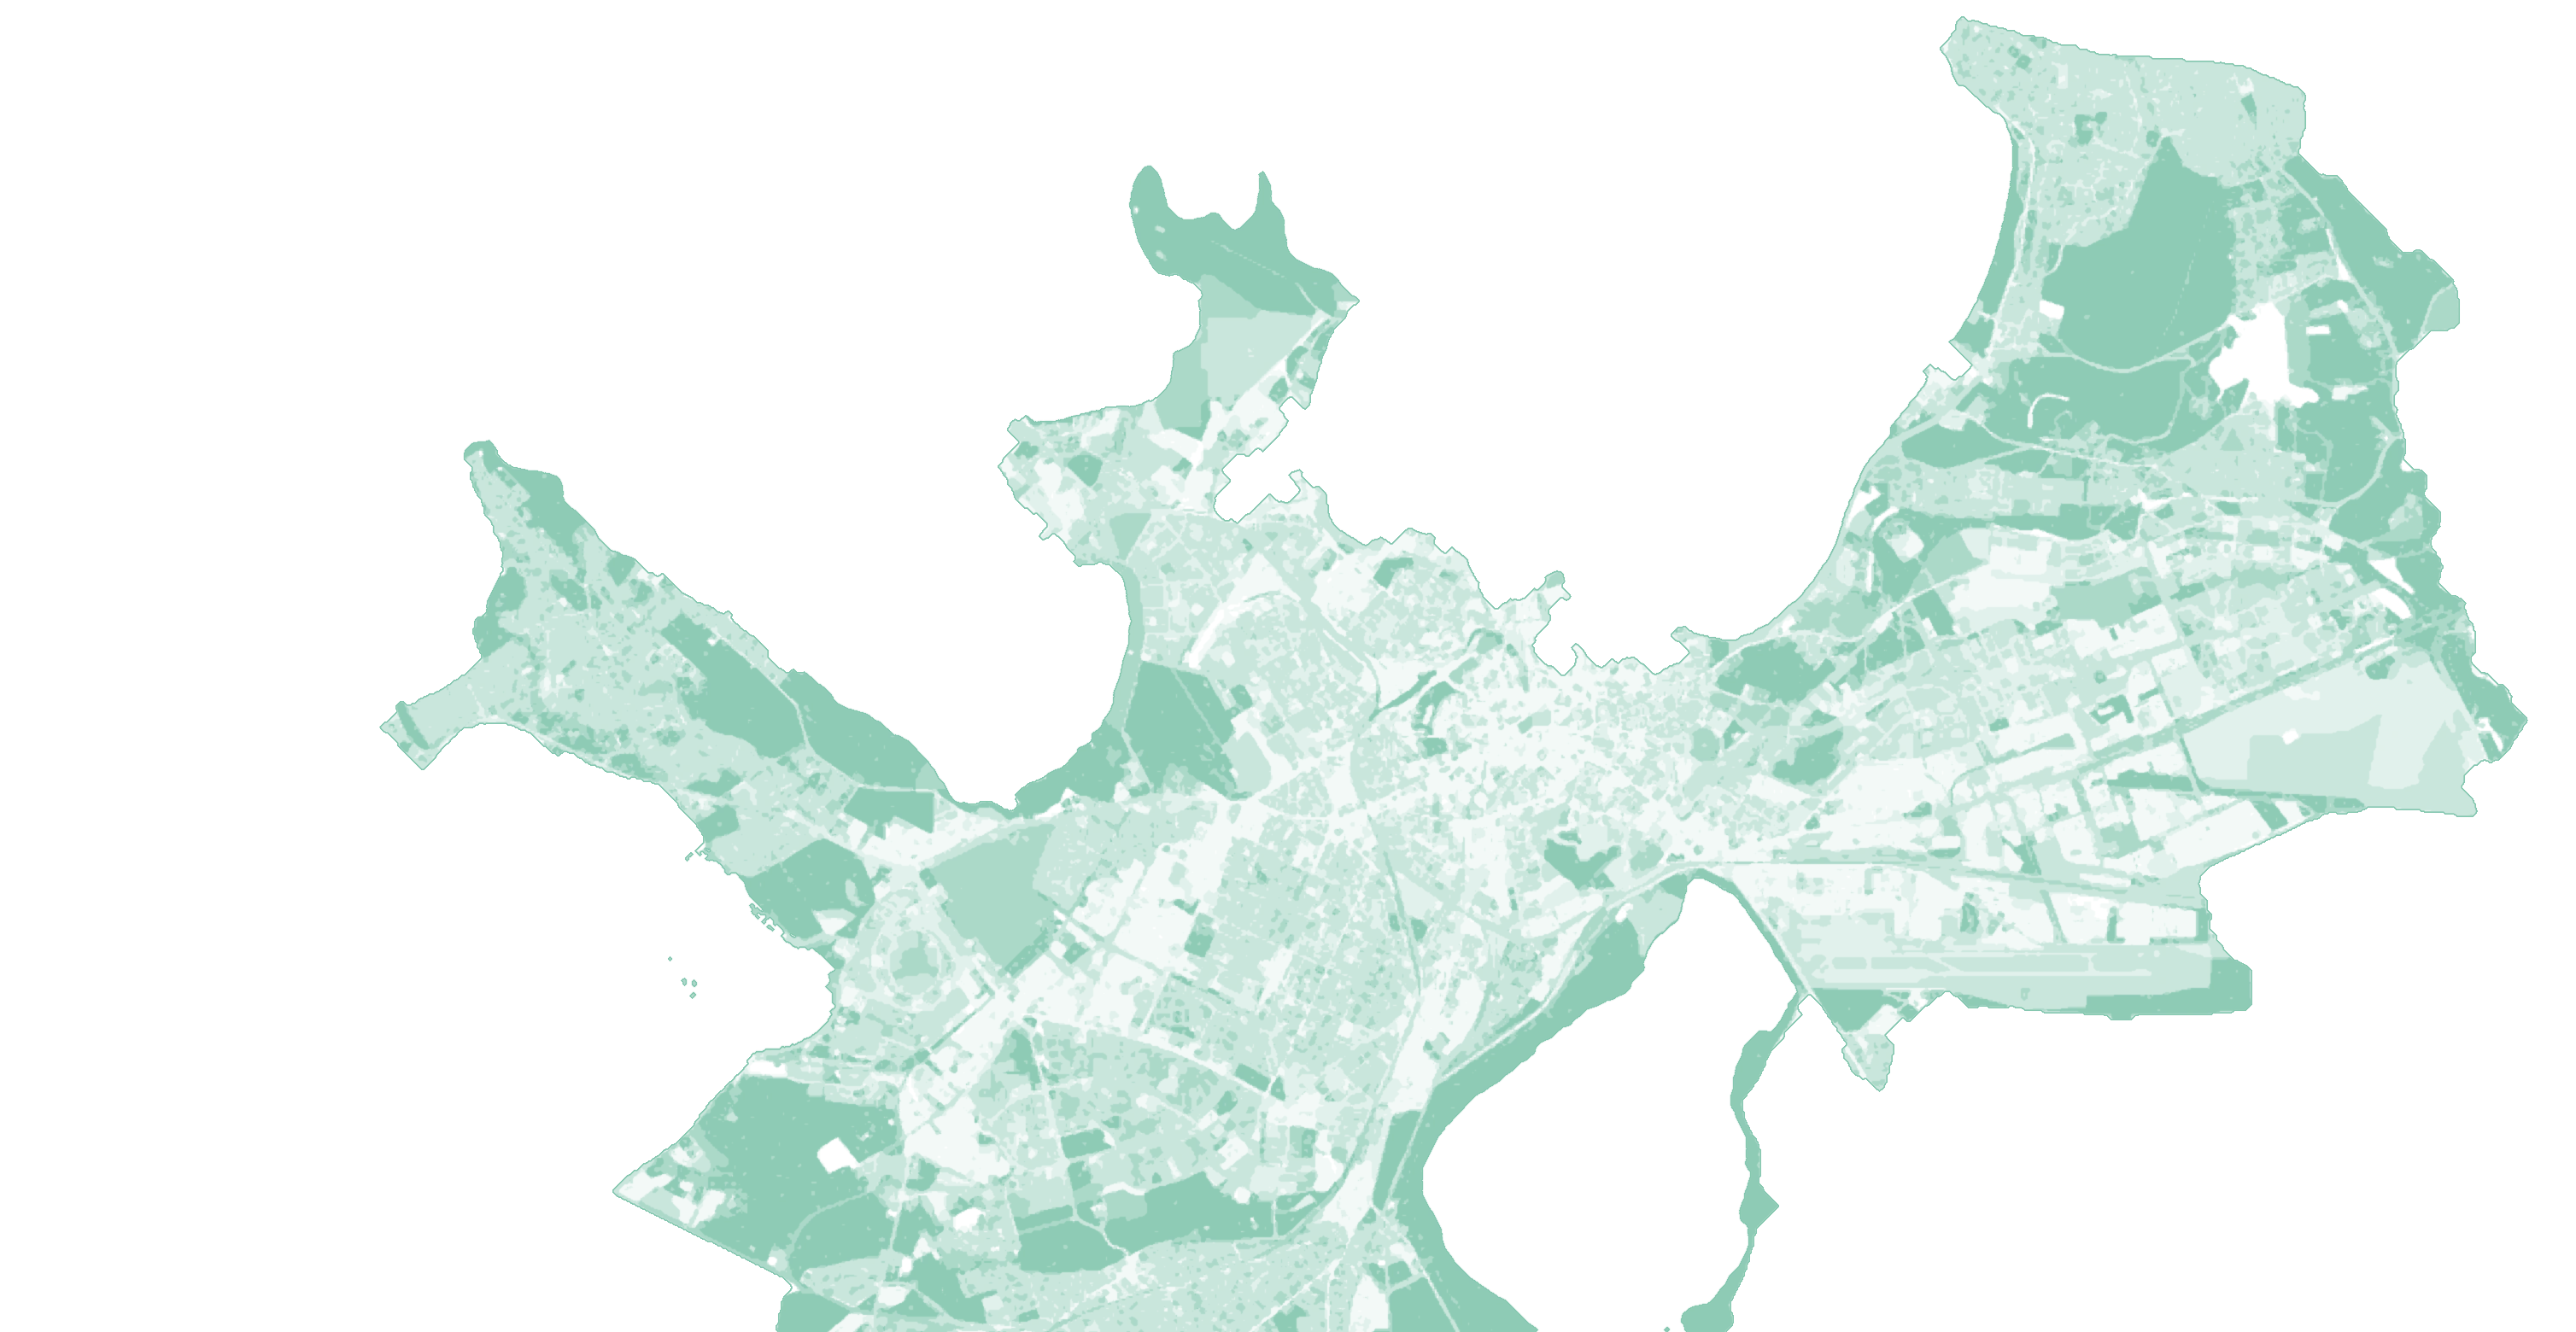
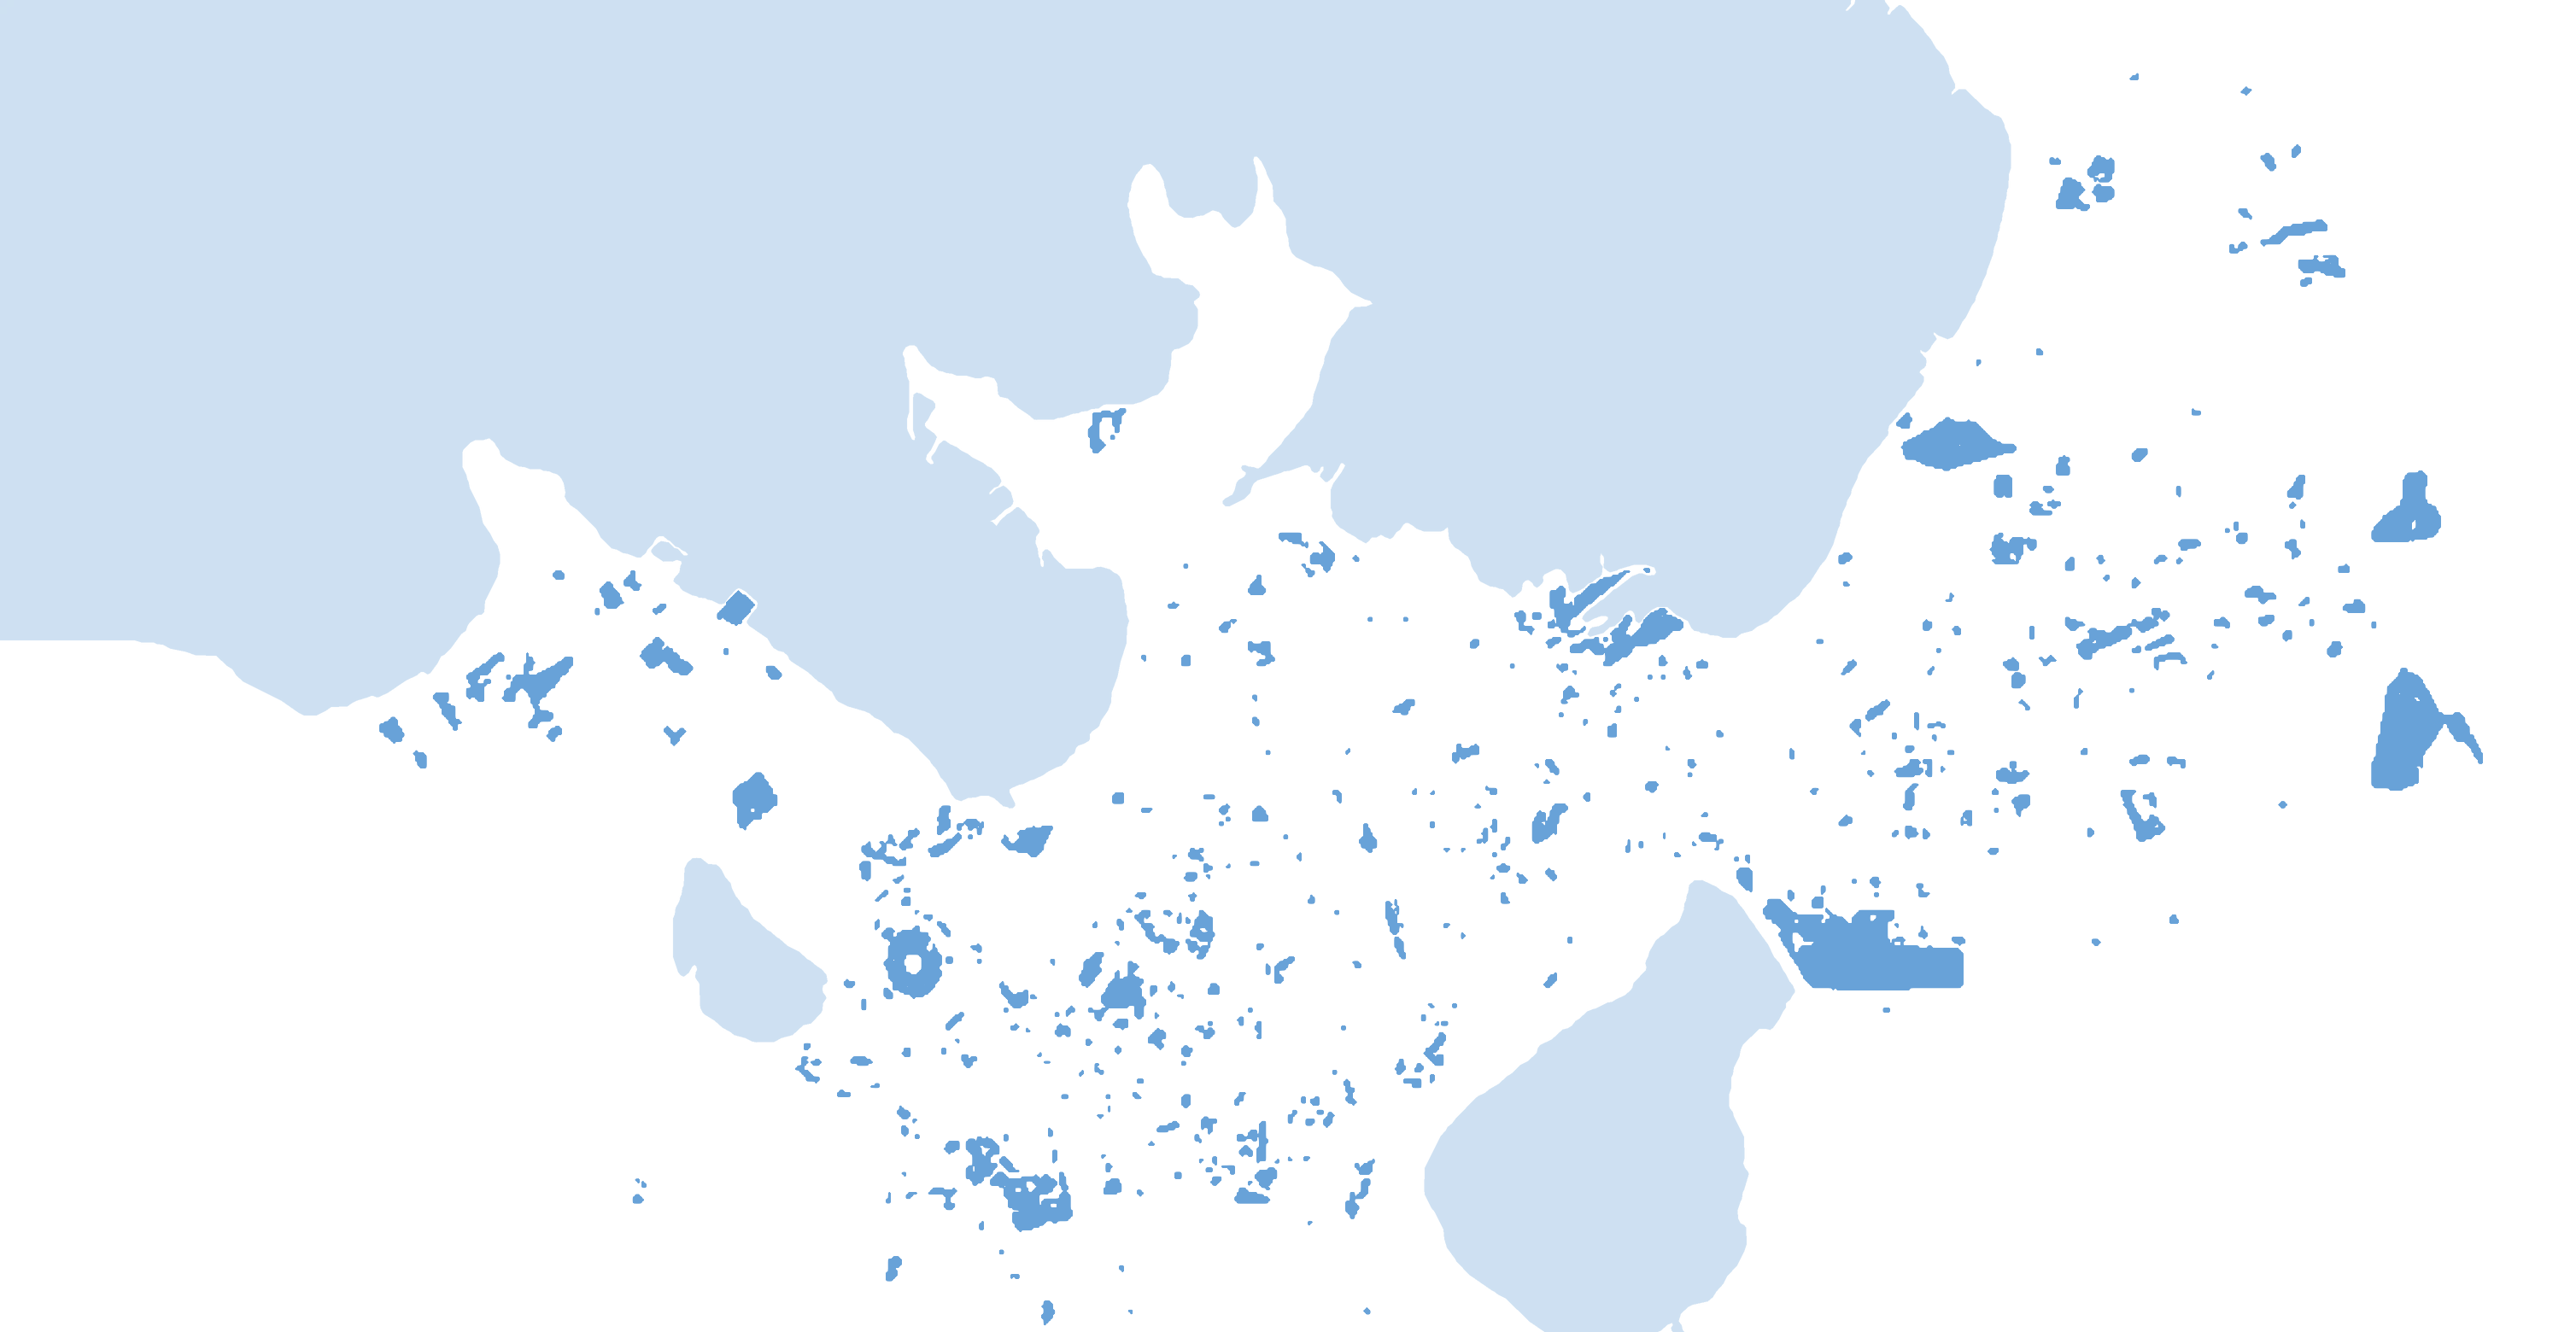
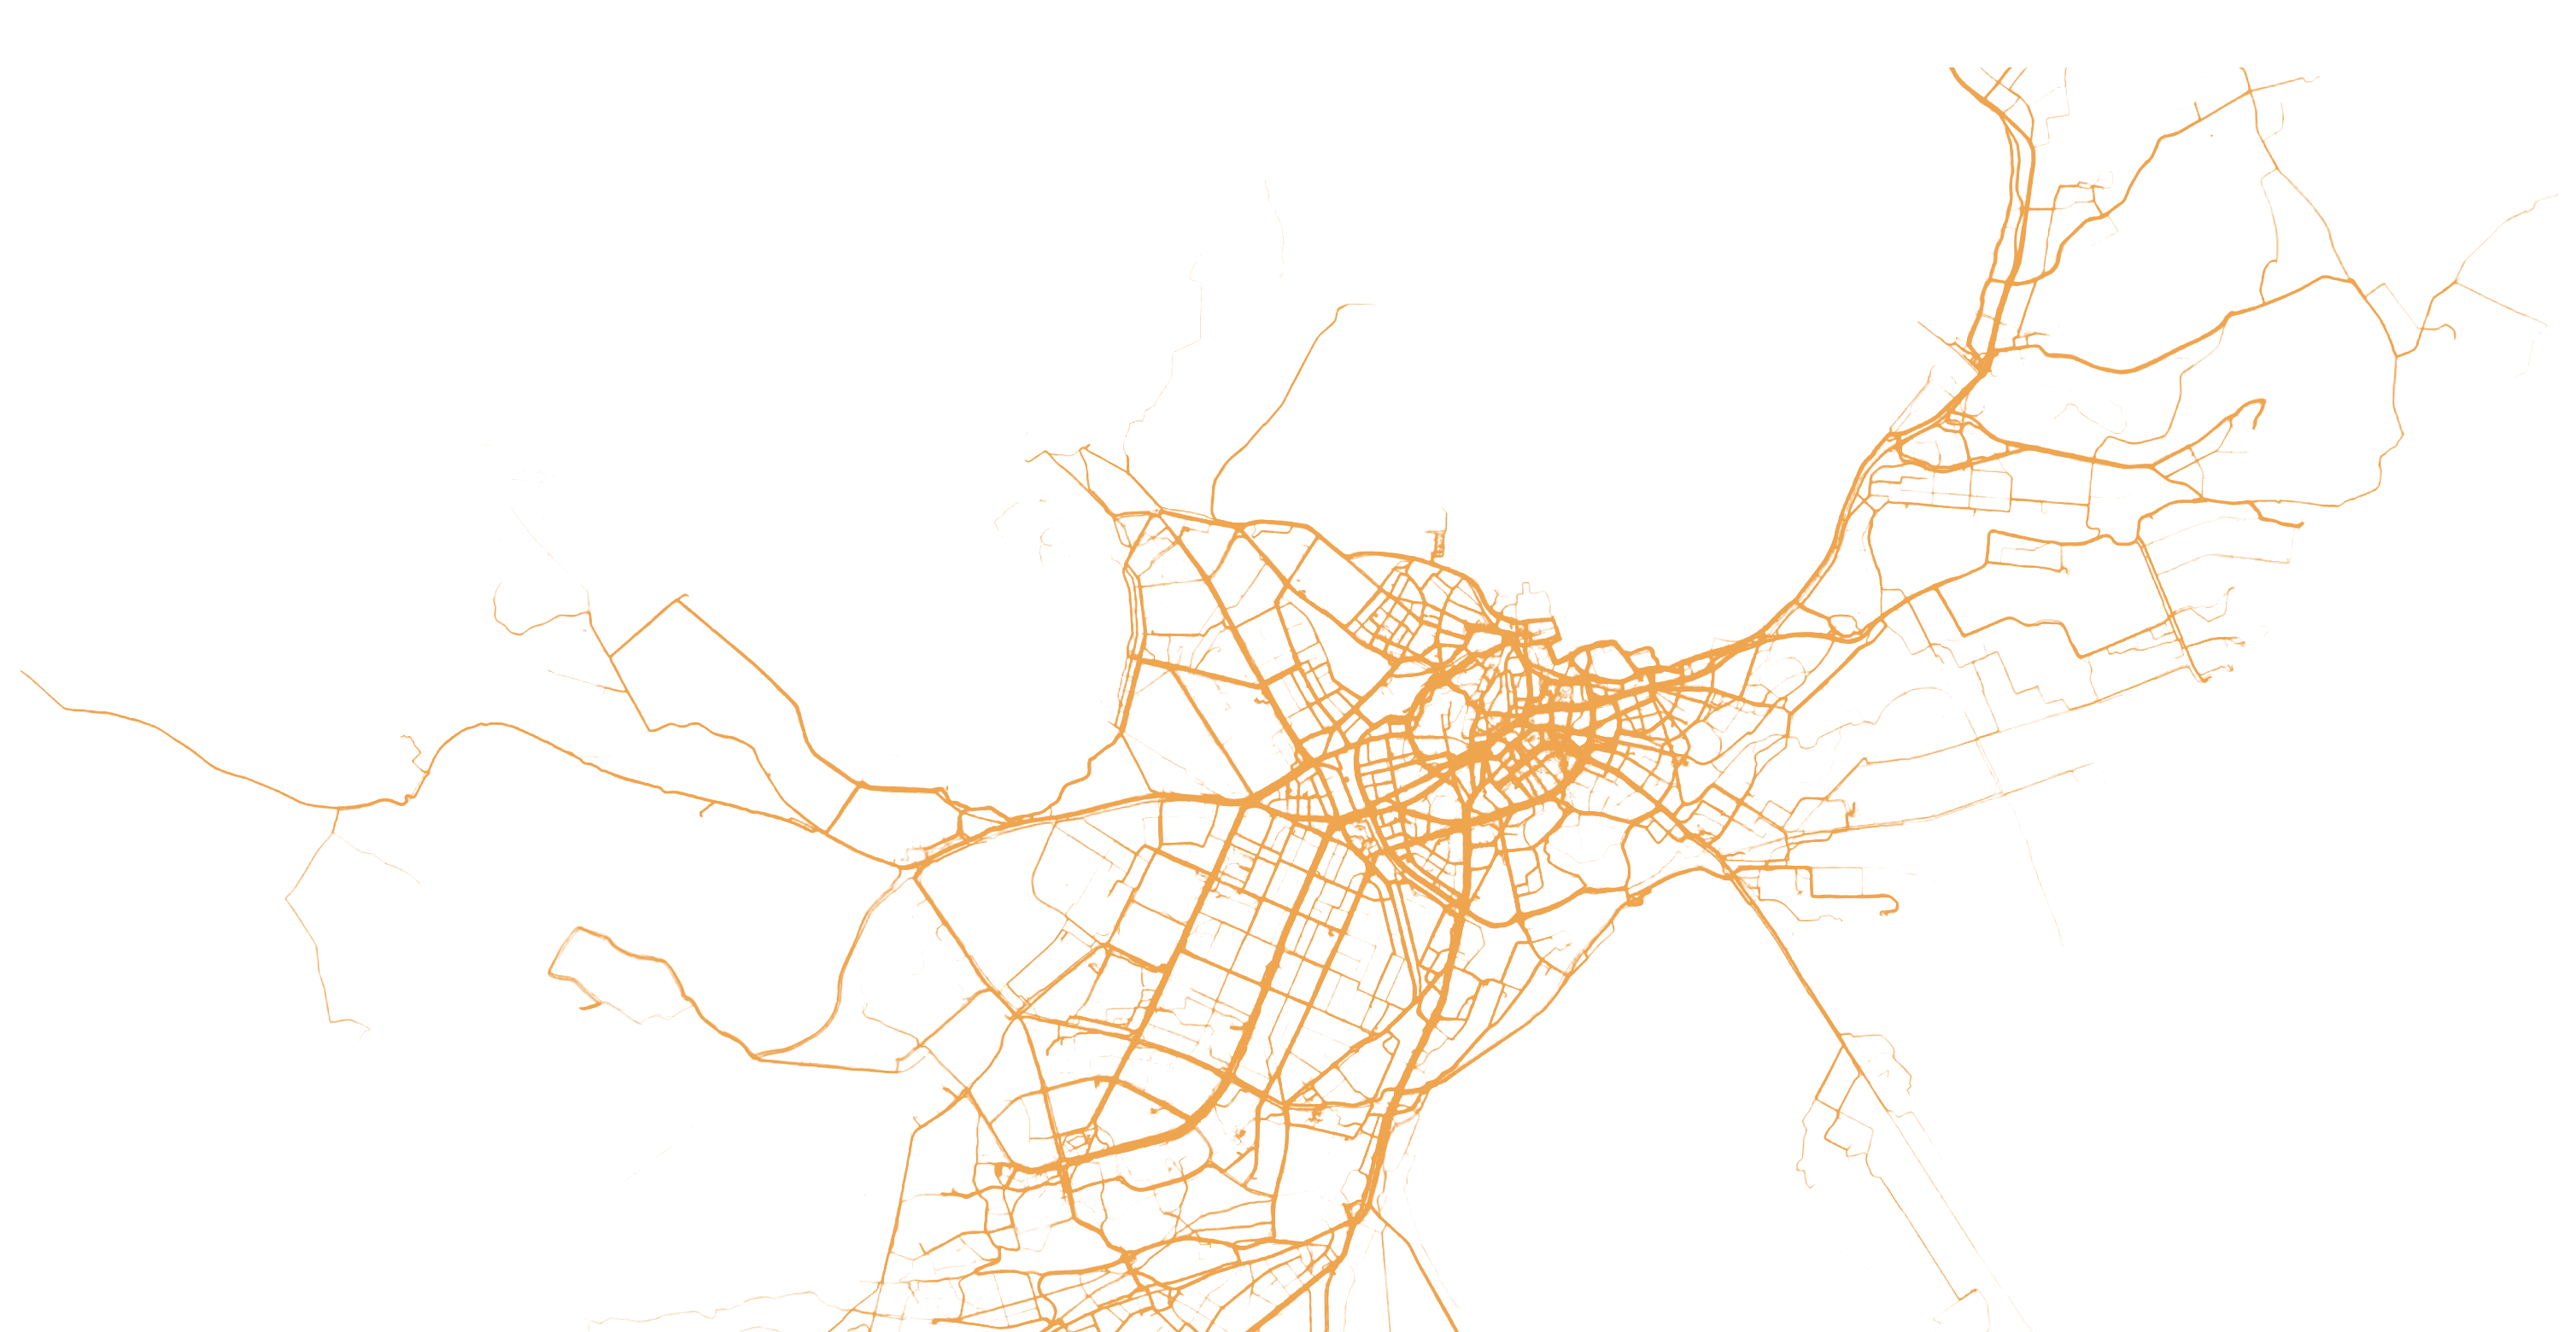
- Tallinn: three of our studies on one map,
the city read the three ways together - Parking areasmetaPARK, 2019
- Routes cycledTallinn cycling patterns, 2012
- Green factorTallinn Green Factor, 2022
61 projects by topic
01
Mobility
How people move, park and reach places
We map parking from aerial, satellite and drone images and from payment records, and measure footfall and traffic from existing cameras. We model how easily residents reach services on foot, by bike, by public transport and by car. We review current rules, test findings in workshops with those who will act on them, and compare policy options in scenarios.
Running now · since 2026
Ülemiste CityFor Mainor Ülemiste.
For Mainor Ülemiste.
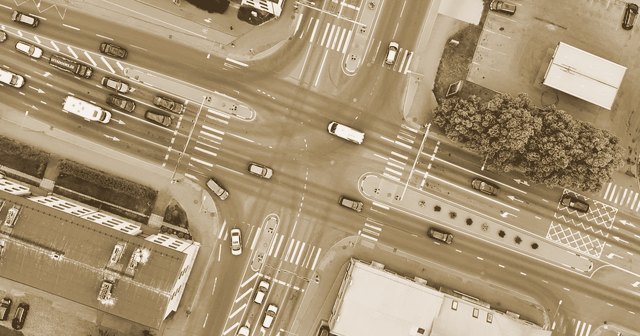
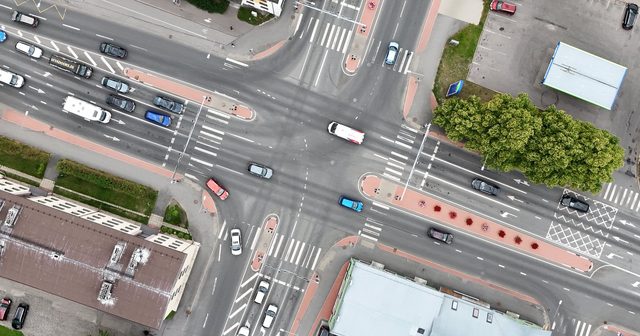
Pärnu has about 107 m² of road and parking per resident, against about 38 m² of home floor area: nearly three times as much.
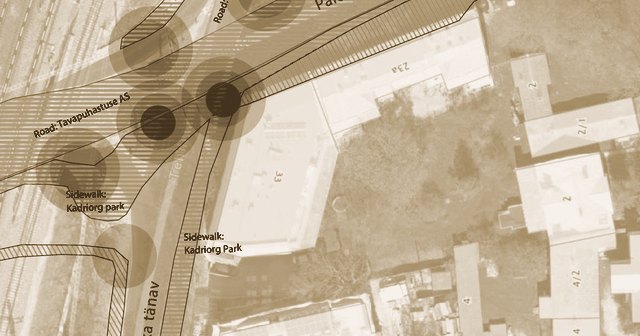
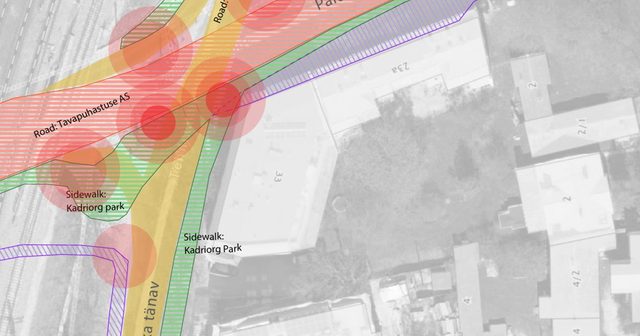
7 of 16 municipalities set footpath and cycle-path clearance widths below the national 1.2 m standard in their own rules; only one exceeds it.
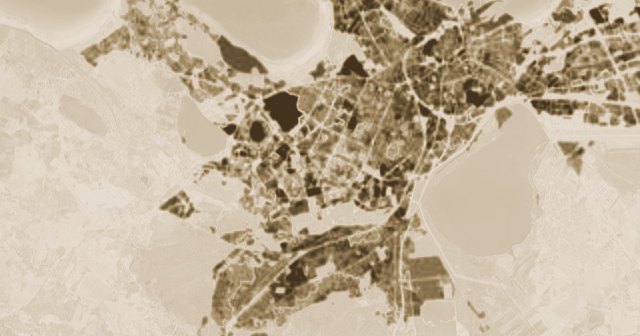
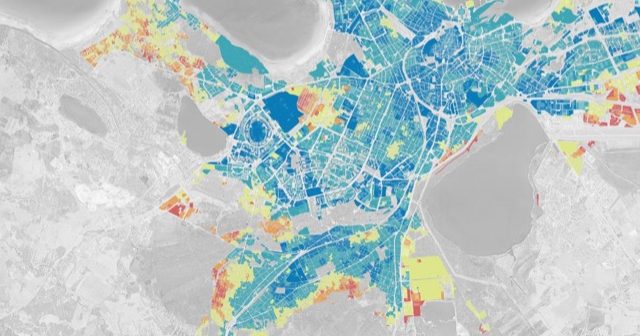
Only 2.7% of Tallinn’s residents live in an area that meets all eight of the study’s criteria for access to essential services.
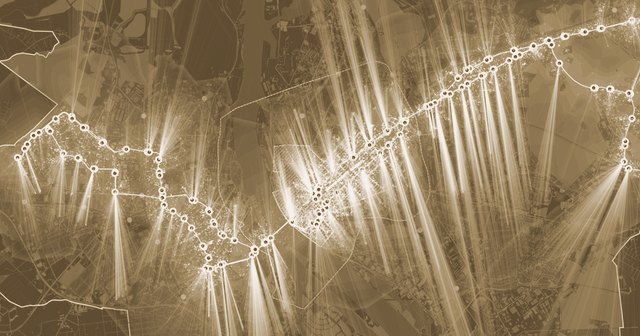
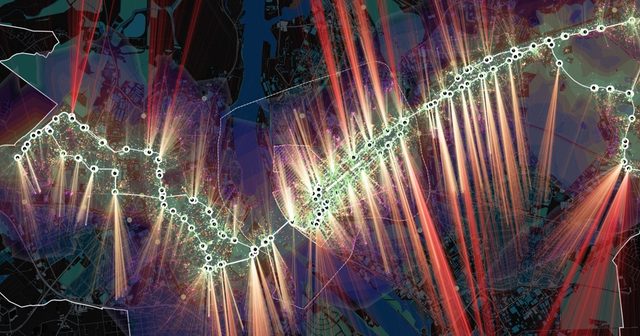
About 98,500 of Riga’s residents live within 300 m of a bus or tram stop; each further 300 m band holds only 22,000–37,000.
02
Public space and city life
How people use streets, squares and centres
We read how public spaces are used, and by whom, from photos and check-ins on social media, comparing places across cities. We have measured street lighting at night with our own sensors and compared it with how well connected each street is. We have mapped the places young people like, and let residents choose between pictures of changes to their block.
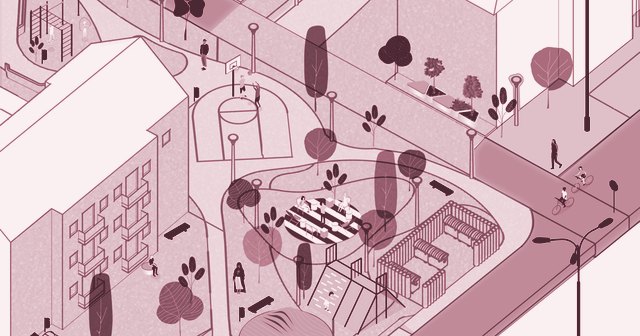
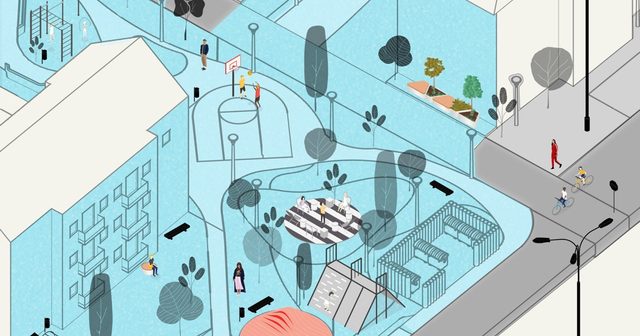
Residents of a 123-apartment block in Prishtina chose between design options generated on photos of their own street; the gardens they tend were kept.
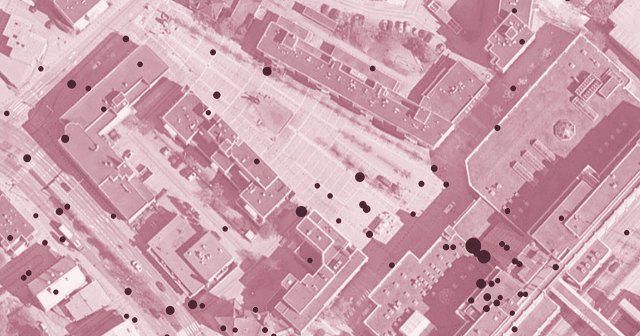
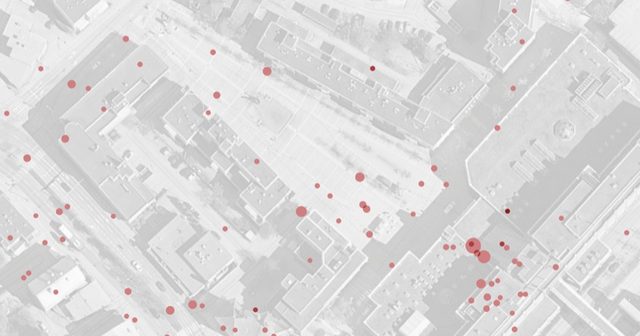
Only 9% of the photos analysed showed people socialising in the square, and just 1 in 100 any spontaneous use.
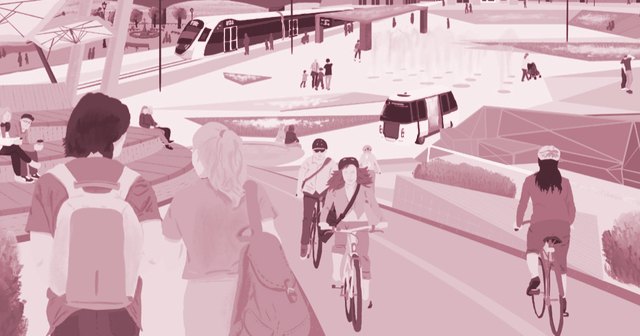
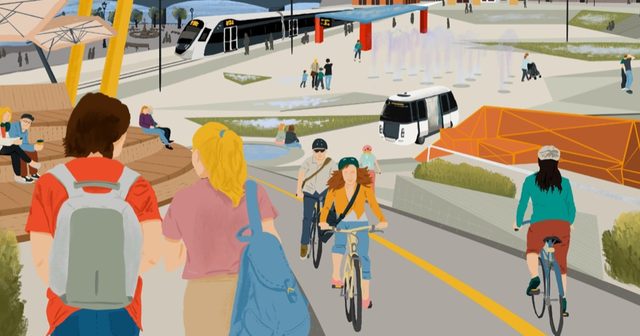
305 people, 60% of them under 30, mapped Narva: the river promenade, old town and city centre are the places they like most.
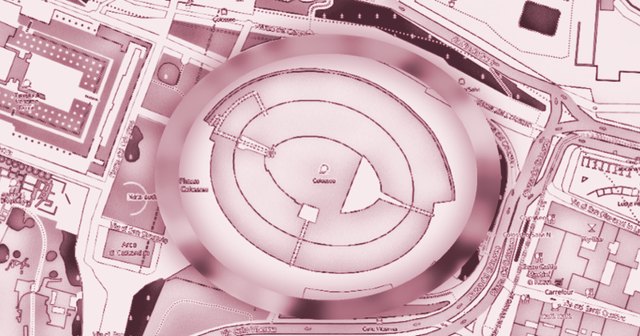
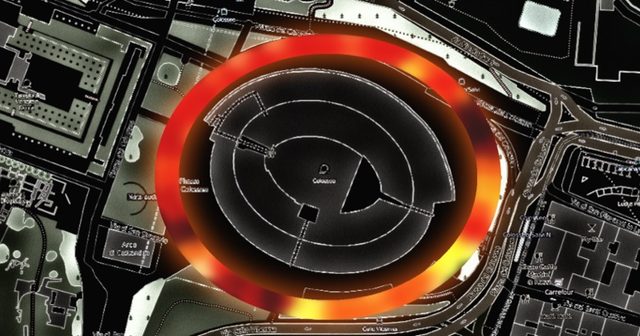
A map of night lighting around the Colosseum, from 4 to 180 lux, measured from a cart carrying a lux meter and GPS.
03
Planning
Land, buildings and the plans that shape them
We have mapped empty homes from electricity use and public registers, first in East Estonia, then nationwide. We score sites and districts on how well connected and how busy they are, and test what could be built there. We give planners guidance and tools, such as a building colour guide for Nikkilä, Finland, and an app for comparing areas of Turku.
Running now · since 2026
TEMA review of how Finland’s state and cities work together, for the Ministry of Economic Affairs and Employment (TEM).
Running now · since 2026
KASETTISegregation monitoring and a national database, for the Finnish Environment Institute (SYKE).
A review of how Finland’s state and cities work together, for the Ministry of Economic Affairs and Employment (TEM).
Segregation monitoring and a national database, for the Finnish Environment Institute (SYKE).
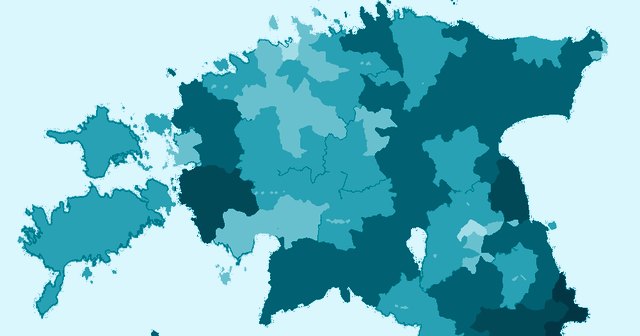
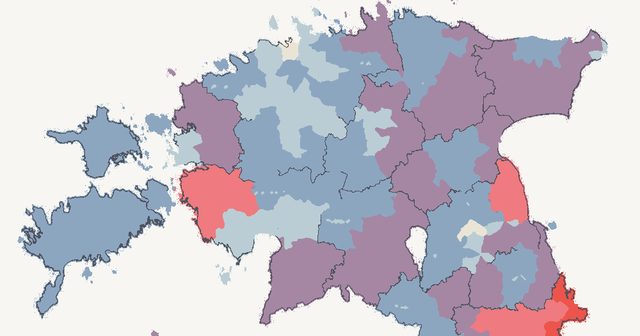
In 2019, 25 municipalities, about a third of Estonia’s, had at least 15% of their homes empty.
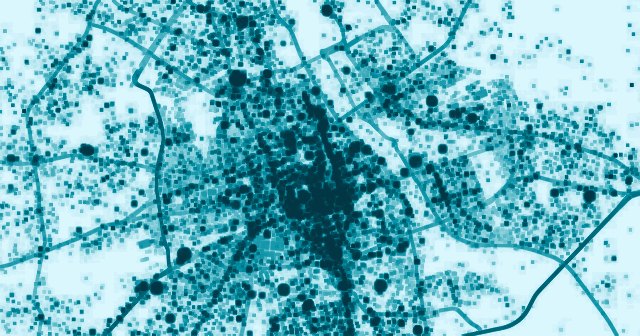
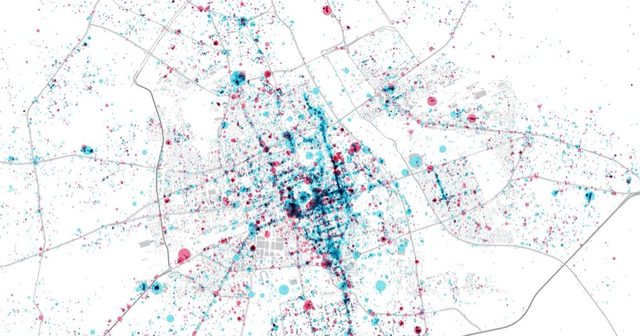
For Warsaw’s new spatial strategy, about 48,000 places listed on Foursquare show activity running in long strips along arterial roads, not in central blocks.

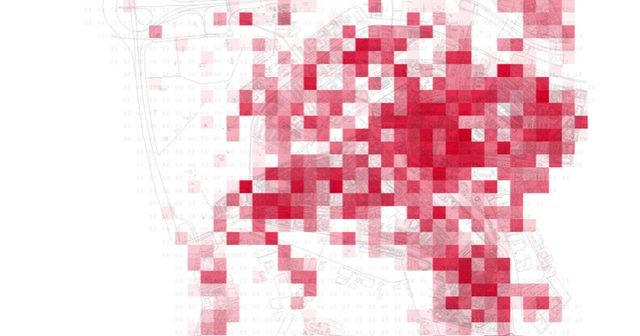
As Schiedam’s shopping streets emptied, the study read over 7,000 Instagram photos and check-in data to propose new uses for three underused sites.
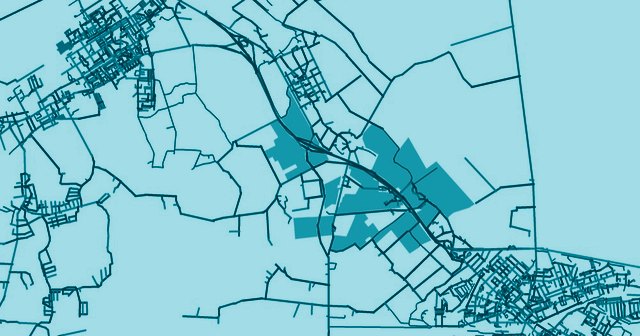
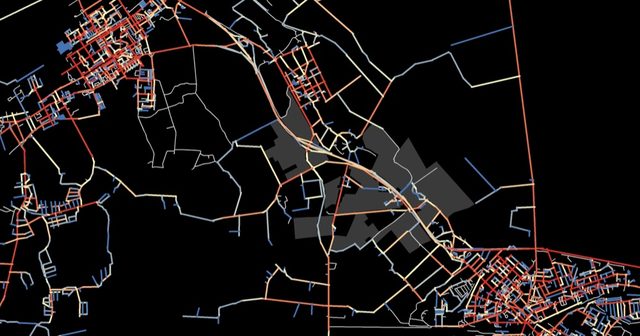
Four development scenarios for a former nursery site near Jõhvi keep density low: buildings would cover 4.8–20.5% of its 238,823 m² of buildable land.
04
Green space, health and climate
Parks, food, health and the climate transition
We have measured how much green space and water people can reach on foot, and mapped greenery around homes from satellite images for medical research. We developed Tallinn’s green space score for new plans and buildings, and tested it with planning and design firms on real projects. We also calculated how much land it would take to feed Tallinn.
Running now · since 2025
Deep Carbon ShiftA European alliance building skills for cities’ climate transition, for the European Commission.
A European alliance building skills for cities’ climate transition, for the European Commission.
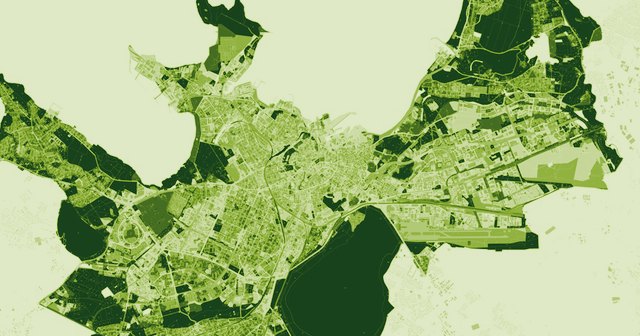
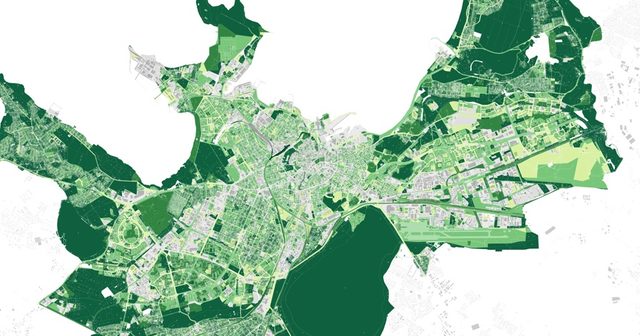
A green-space score for new plans, tested by ten planning and design firms on about twenty real plans and building projects before it was finalised.
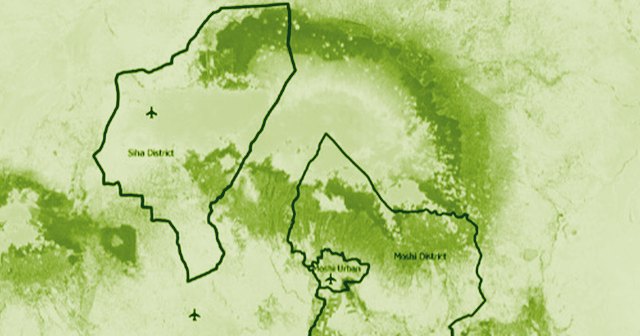
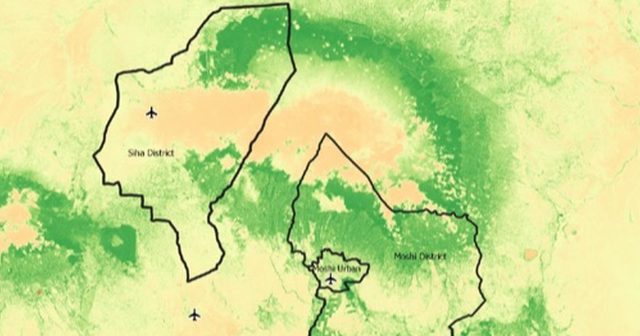
Satellite measures of greenness, land cover and climate around homes in urban Moshi (about 230,000 people) and rural Siha (about 142,000), for an asthma study.
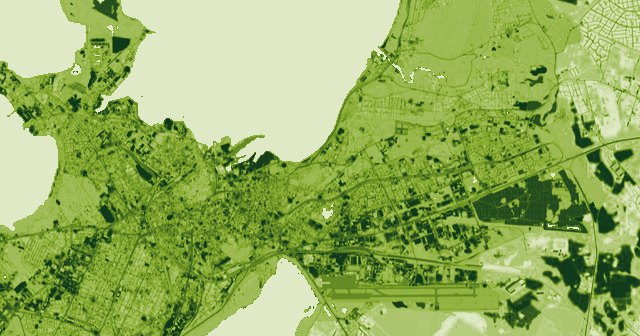
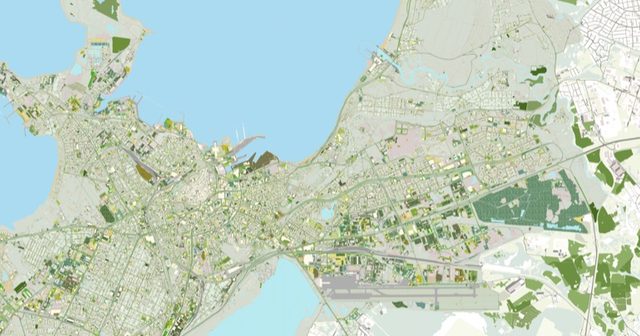
Tallinn grows food on about 1% of its land; feeding the city on current diets would take about 20% (30 km²).
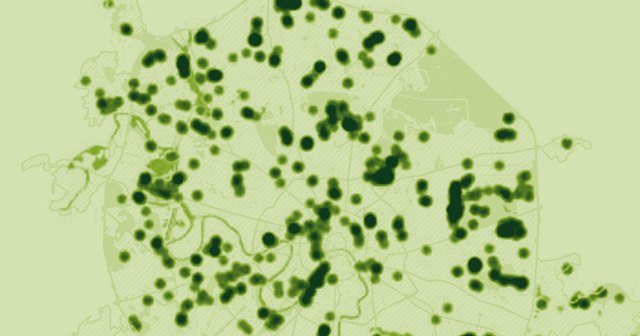
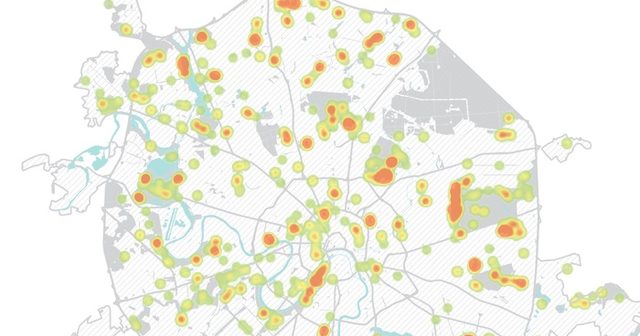
Most of Moscow has green space within walking reach; the barrier is a disconnected street network, and the busiest walking routes mostly pass the parks by.