All 61 projects since 2012, newest first, grouped by
All 61 projects, newest first, each ticket in the colour of its group above.Running now, not on this list yet: TEM (since 2026), a review of how Finland’s state and cities work together, for the Ministry of Economic Affairs and Employment (TEM); KASETTI (since 2026), segregation monitoring and a national database, for the Finnish Environment Institute (SYKE); Deep Carbon Shift (since 2025), a European alliance building skills for cities’ climate transition, for the European Commission; and Ülemiste City (since 2026), for Mainor Ülemiste.
PlanningWe made:
Data tools and platformsScale:
A region, a country or many citiesFor:
Universities, culture and our own research
none
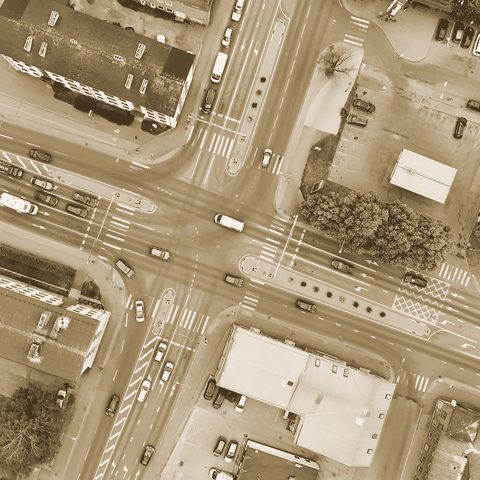
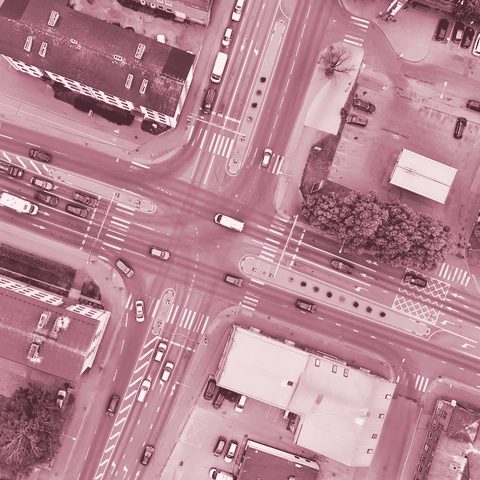
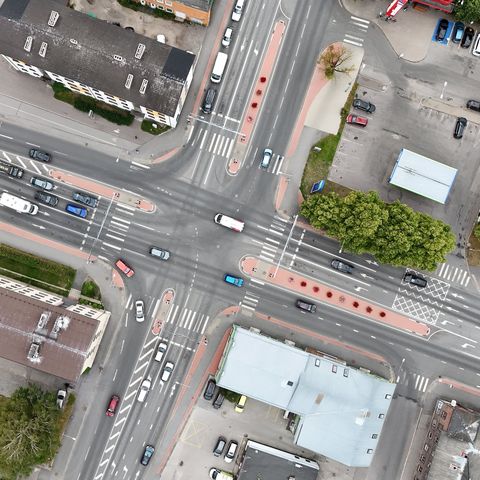
Building Registry (EHR) Data Pipeline — TalTech
Turns exports from Estonia’s national building registry into clean map data on buildings, filtered by construction year and use.

MobilityWe made:
Policy reviews and blueprintsScale:
A whole cityFor:
Cities and municipalities
4
Pärnu Parking Analysis & Strategy
Pärnu has about 107 m² of road and parking per resident, against about 38 m² of home floor area: nearly three times as much.
MobilityWe made:
Policy reviews and blueprintsScale:
A region, a country or many citiesFor:
Cities and municipalities
2
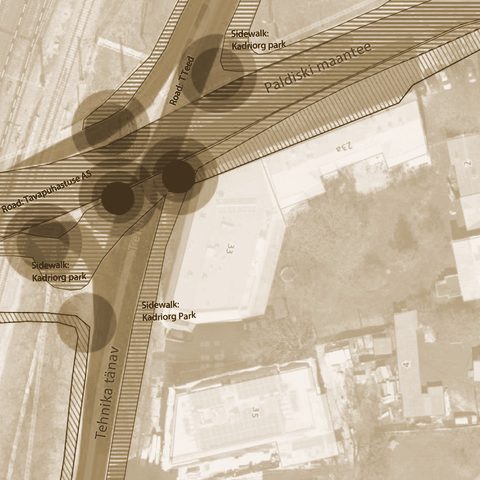
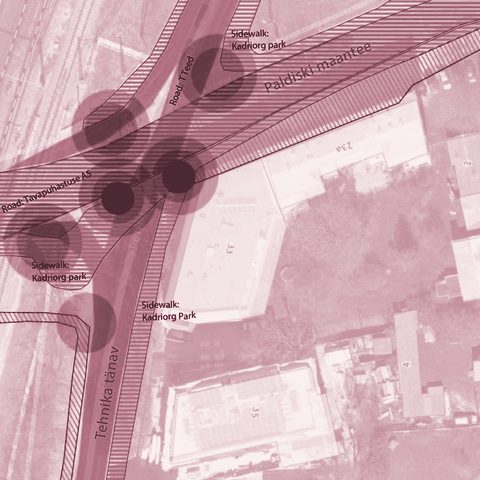
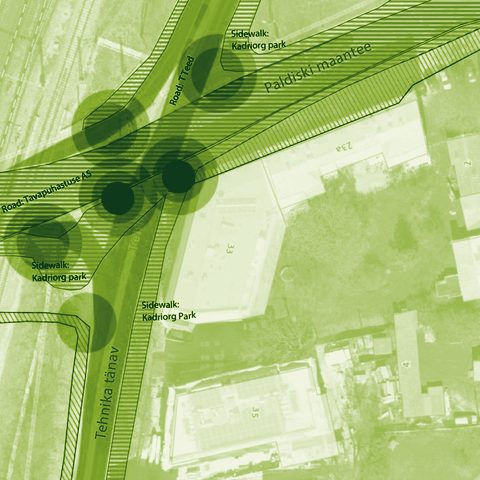
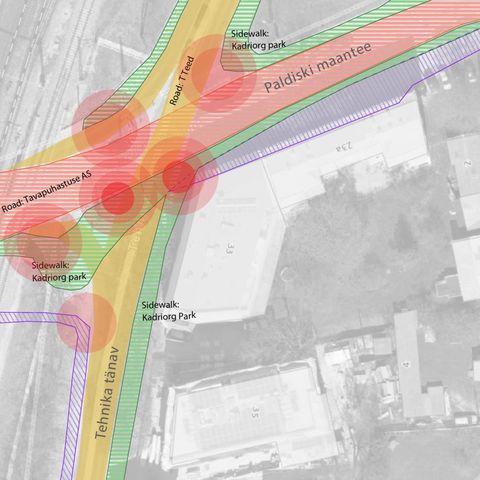
Winter Maintenance for Walking and Cycling — Harju County
7 of 16 municipalities set footpath and cycle-path clearance widths below the national 1.2 m standard in their own rules; only one exceeds it.
MobilityWe made:
AnalysesScale:
A whole cityFor:
Cities and municipalities
2
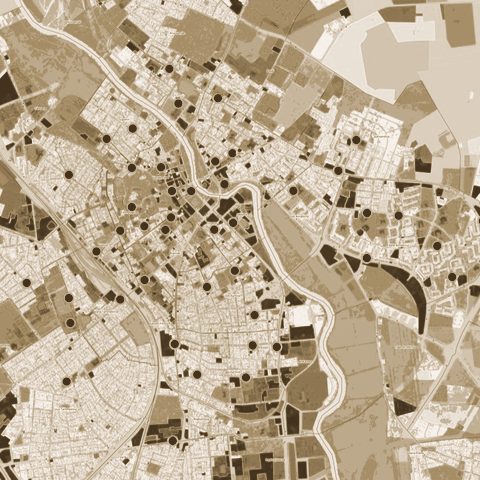
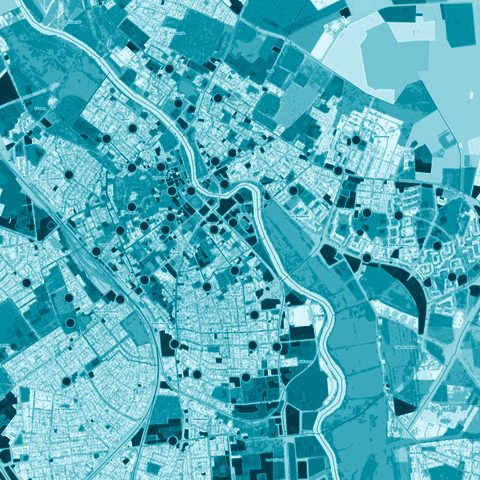
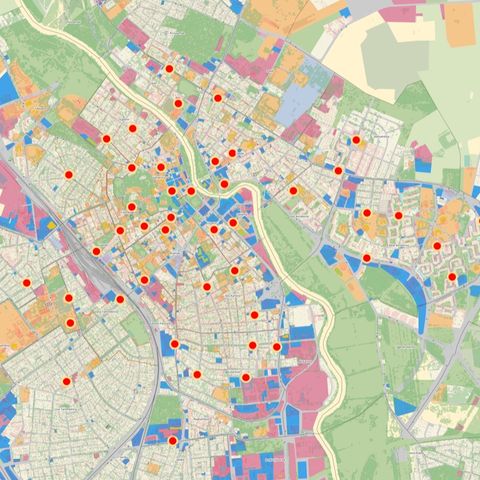
Tartu Parking Policy Baseline Analysis
Only about 25–28% of the time cars spend parked in Tartu’s most expensive zones is paid for.
MobilityWe made:
AnalysesScale:
A whole cityFor:
Cities and municipalities
2
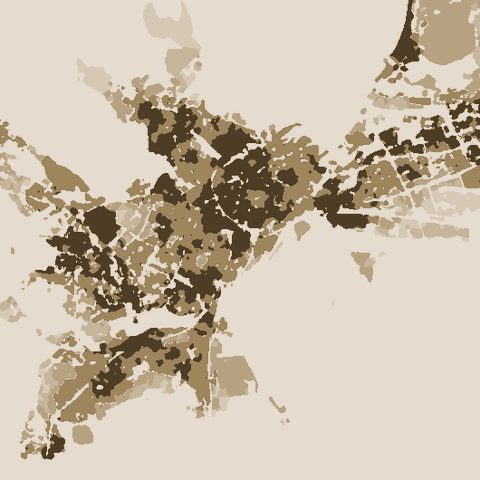
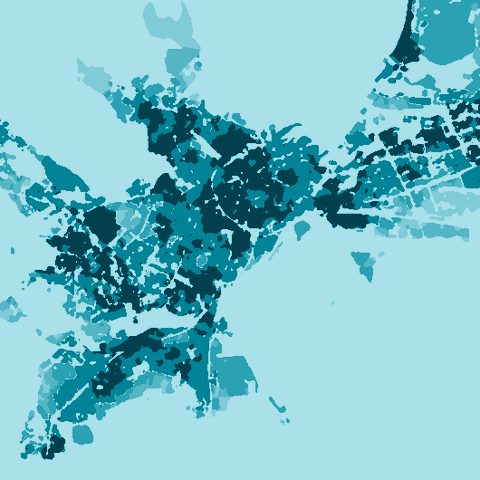
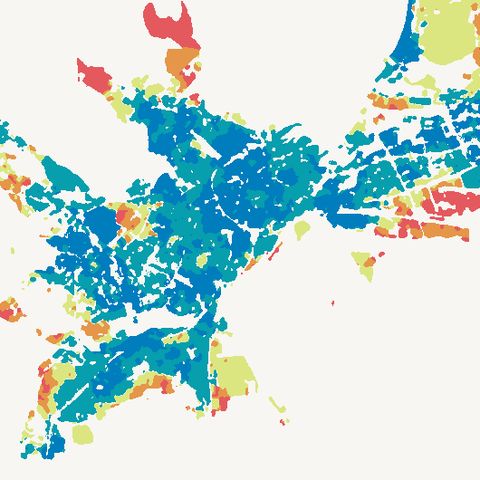
Tallinn Service Accessibility Analysis
Only 2.7% of Tallinn’s residents live in an area that meets all eight of the study’s criteria for access to essential services.
Public space and city lifeWe made:
Data tools and platformsScale:
A region, a country or many citiesFor:
Universities, culture and our own research
4
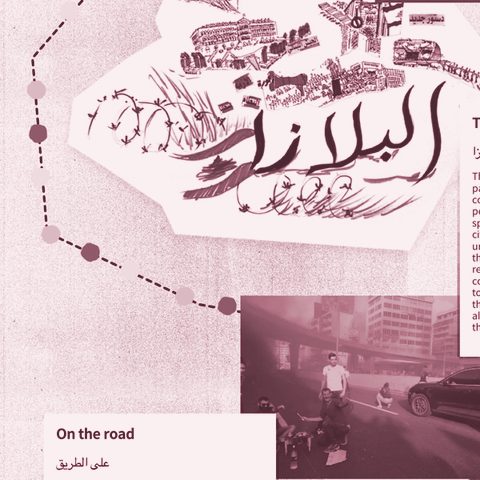
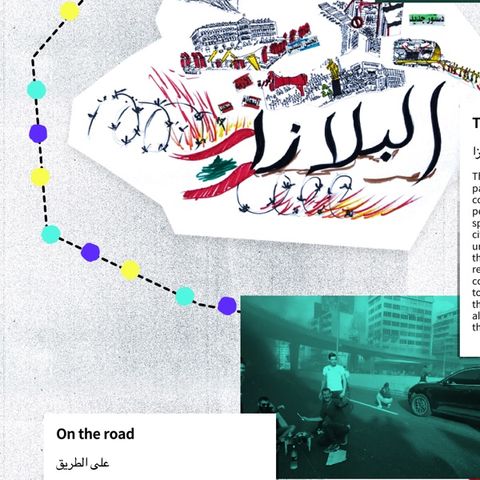
Lebanon Unsettled
An archive and public website on Lebanon’s October 2019 uprising, set in nearly 200 years of popular revolt.
Public space and city lifeWe made:
Visions and co-designScale:
A street or a squareFor:
Ministries and public agencies
1
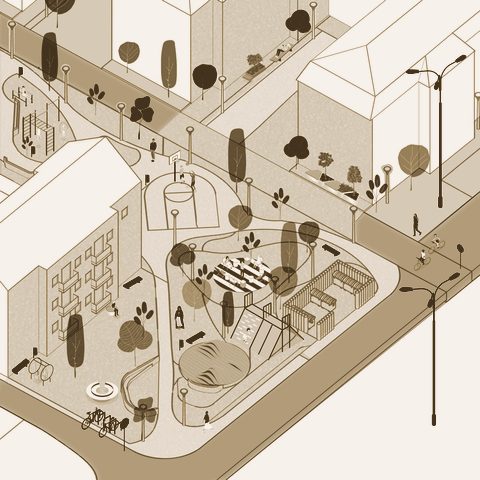
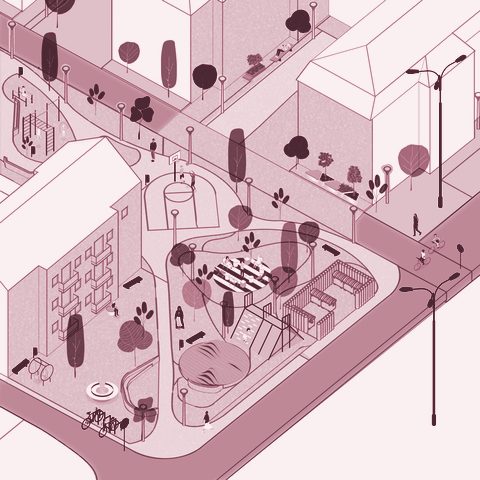
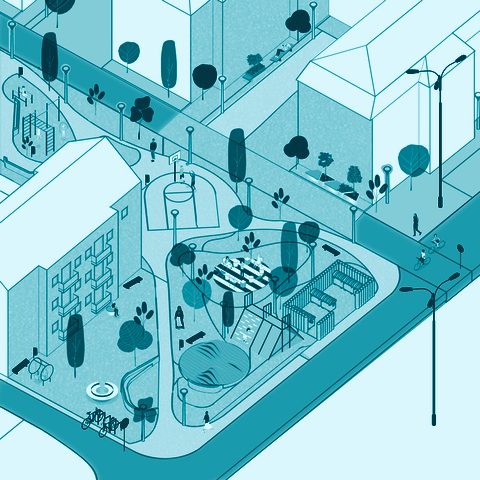
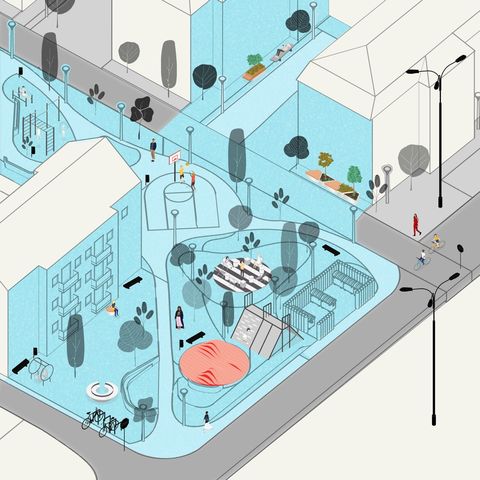
Block 1 — Reimagining a Socialist-Era Superblock in Prishtina
Residents of a 123-apartment block in Prishtina chose between design options generated on photos of their own street; the gardens they tend were kept.
MobilityWe made:
Data tools and platformsScale:
A region, a country or many citiesFor:
Ministries and public agencies
1
SMARTLAND by TELT — Interactive Storymap
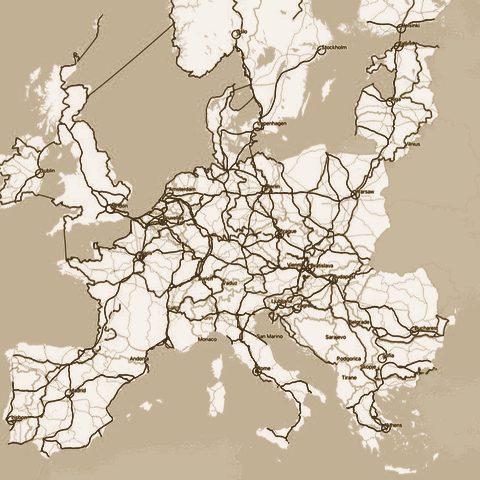
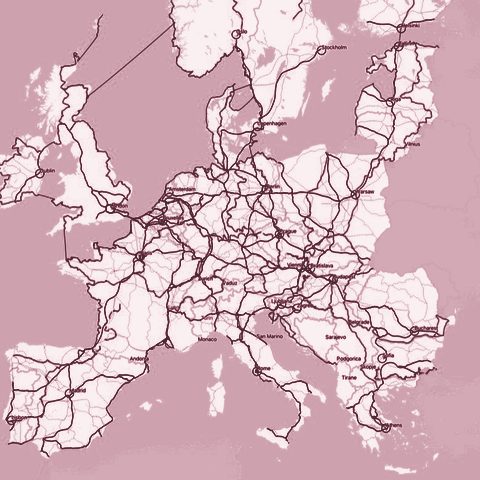
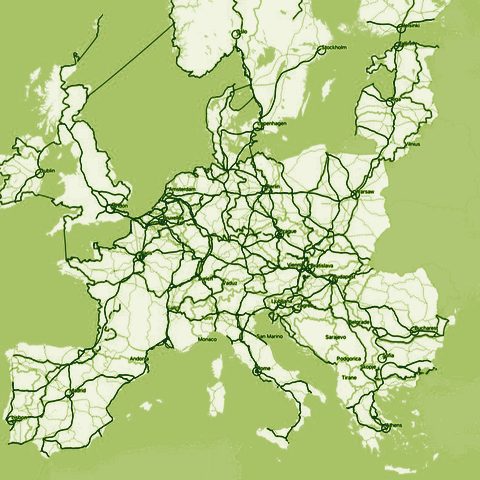
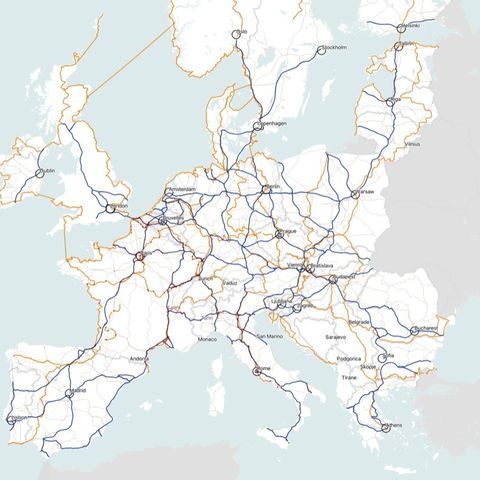
A public storymap that zooms from Europe’s rail network down to the attractions, food and trails of the valleys along the Lyon–Turin line.
MobilityWe made:
AnalysesScale:
A district or a siteFor:
Developers, companies and practices
none
Footfall scenarios for a Rail Baltica station development
Pedestrian flows around a new Rail Baltica station, measured from camera footage and simulated to compare designs for the building next to it.
Green space, health and climateWe made:
Policy reviews and blueprintsScale:
A whole cityFor:
Cities and municipalities
1
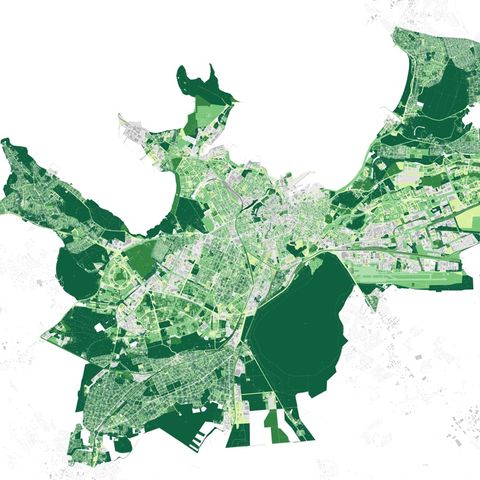
Tallinn Green Factor (Rohefaktor)
A green-space score for new plans, tested by ten planning and design firms on about twenty real plans and building projects before it was finalised.
PlanningWe made:
AnalysesScale:
A region, a country or many citiesFor:
Ministries and public agencies
3
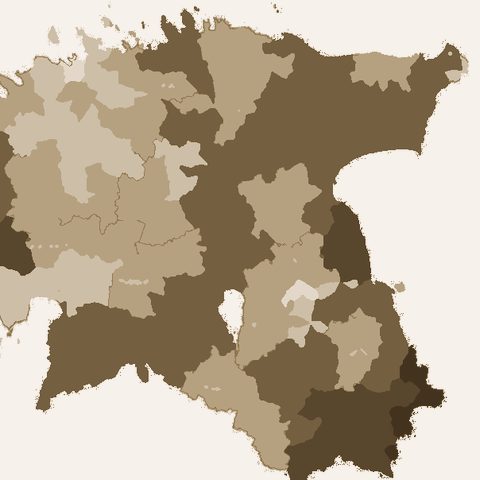
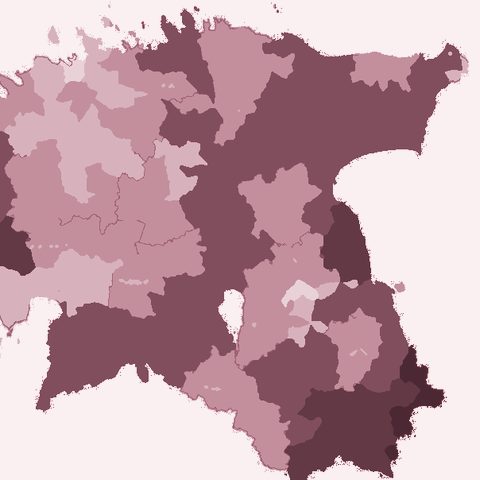
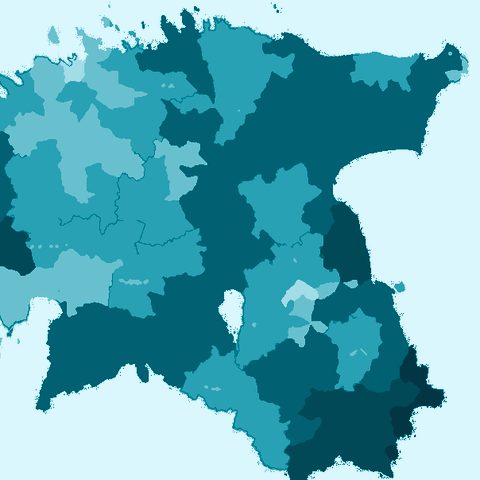
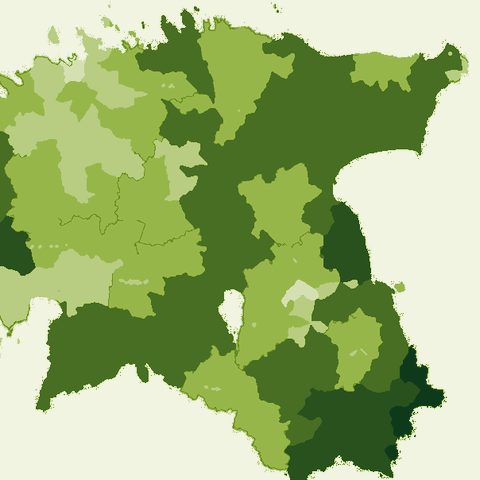
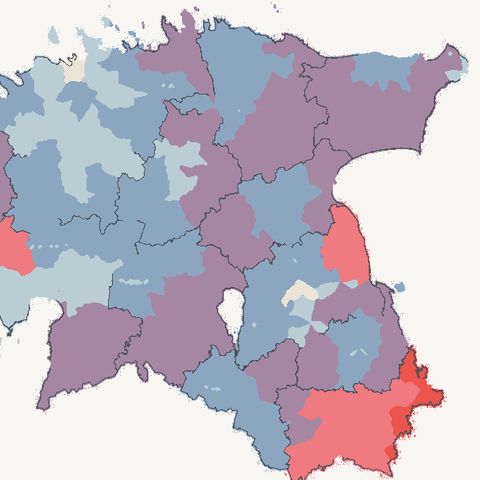
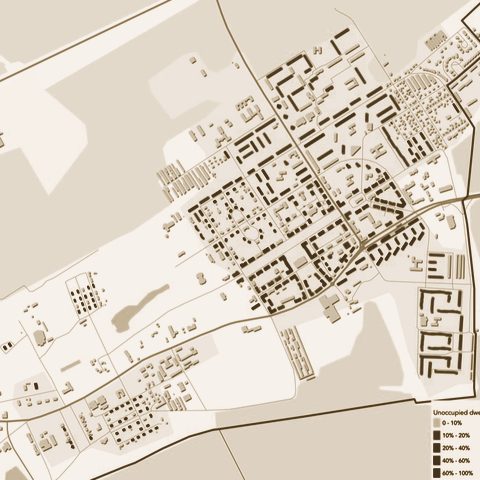
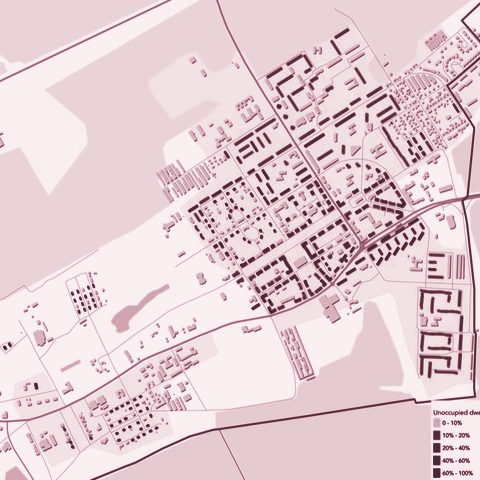
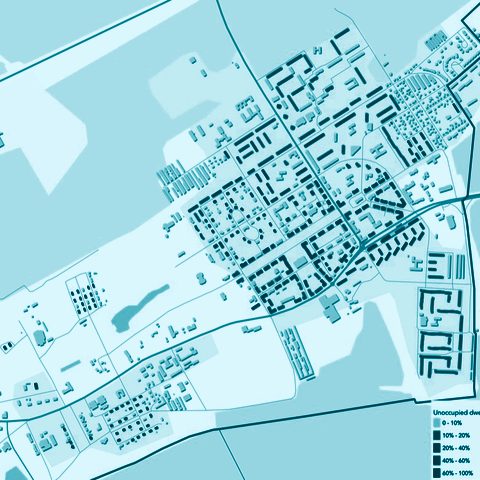
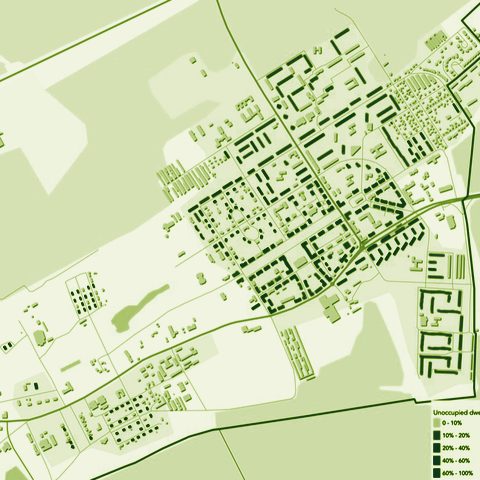
National Study of Shrinking Patterns in Estonia
In 2019, 25 municipalities, about a third of Estonia’s, had at least 15% of their homes empty.
Green space, health and climateWe made:
AnalysesScale:
A region, a country or many citiesFor:
Universities, culture and our own research
1
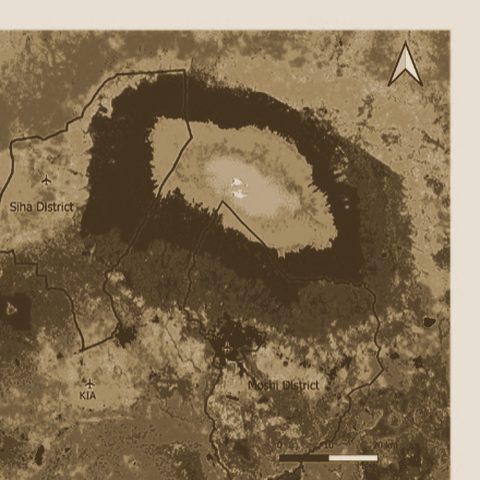
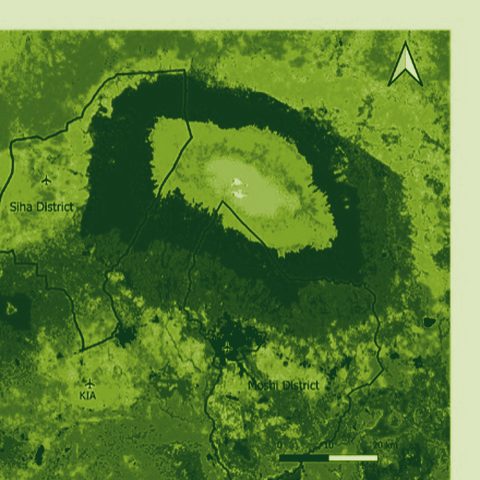
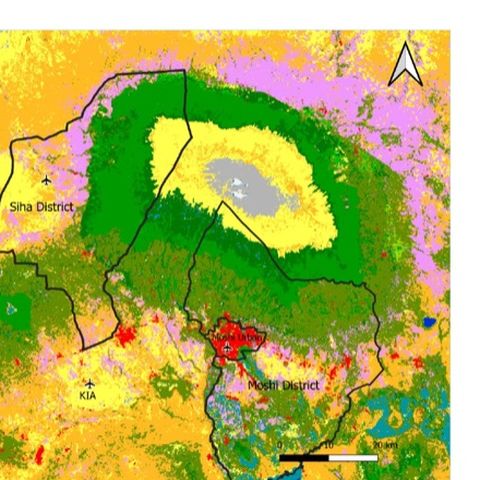
RIPA2TAN — Environmental Drivers of Health in the Kilimanjaro Region
Satellite measures of greenness, land cover and climate around homes in urban Moshi (about 230,000 people) and rural Siha (about 142,000), for an asthma study.
Green space, health and climateWe made:
AnalysesScale:
A whole cityFor:
Universities, culture and our own research
none
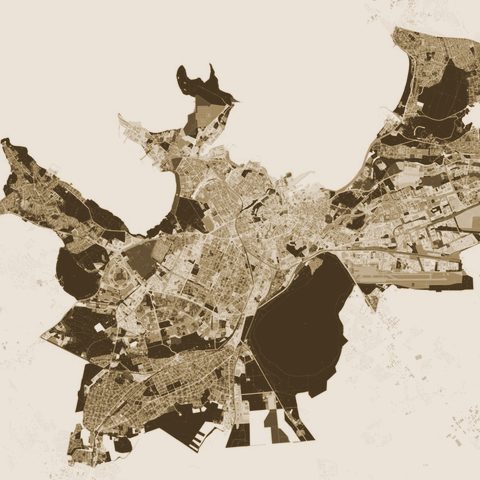
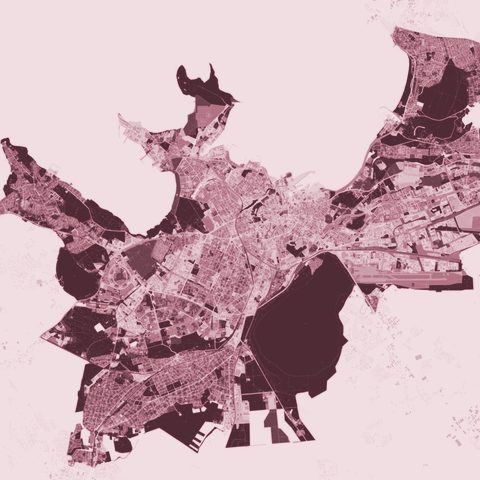
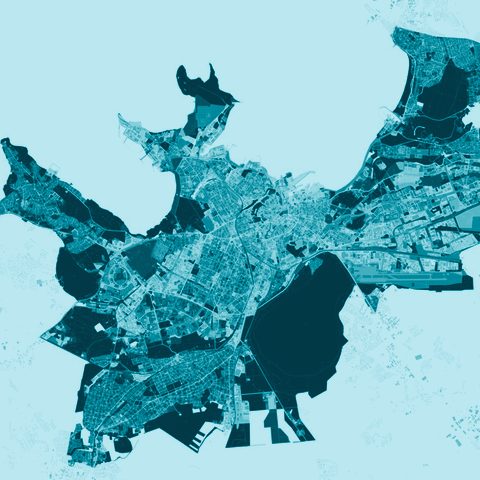
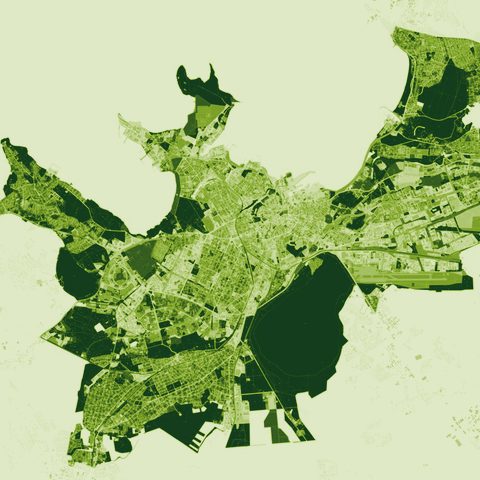
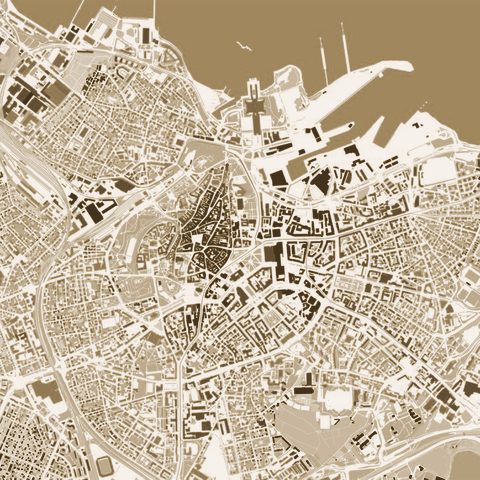
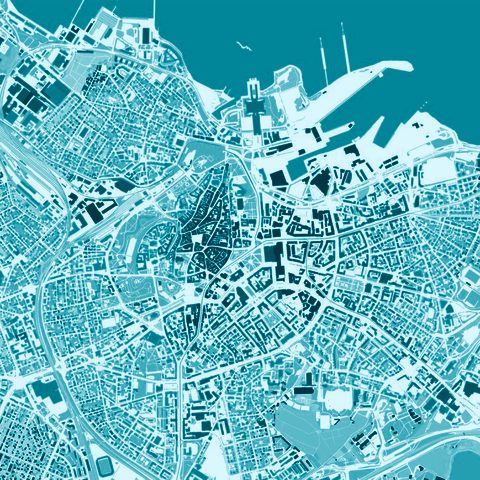
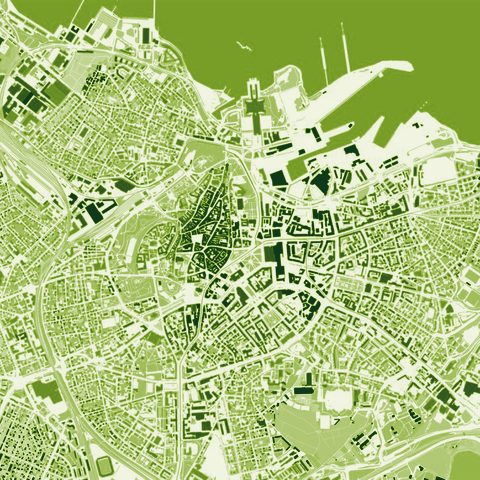
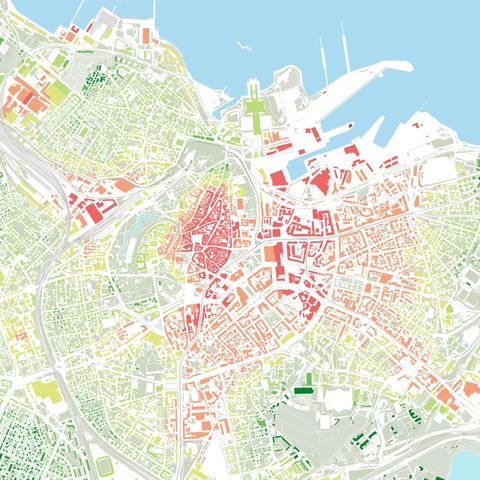
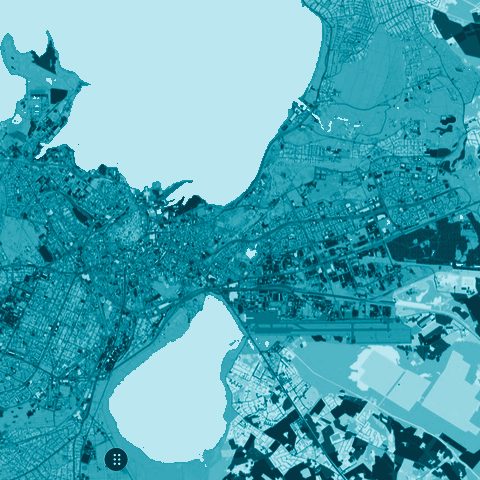
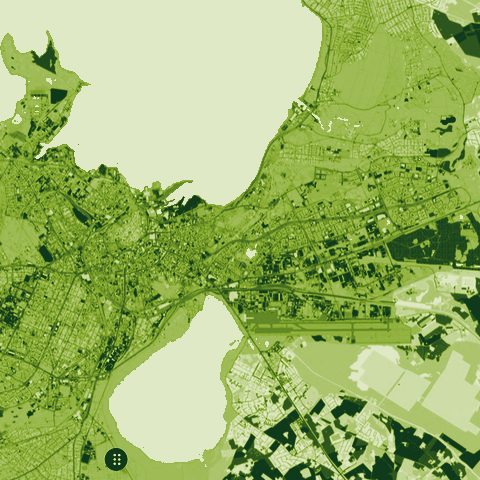
Land use analysis Tallinn
PlanningWe made:
AnalysesScale:
A region, a country or many citiesFor:
Cities and municipalities
2
Ida-Viru County Shrinking Cities Analysis
The method for finding empty homes from electricity use, first tested in two municipalities in 2020, applied across all of Ida-Viru County.
Public space and city lifeWe made:
Data tools and platformsScale:
A street or a squareFor:
Cities and municipalities
2
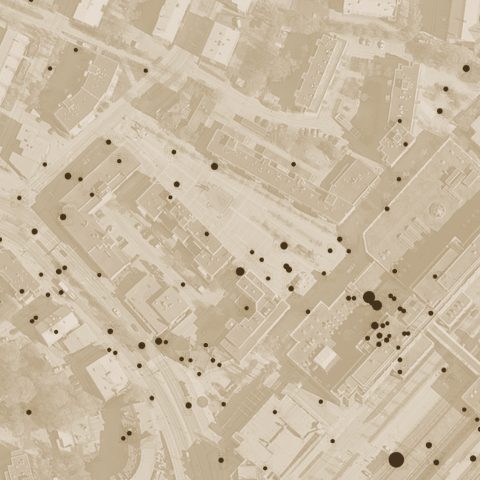
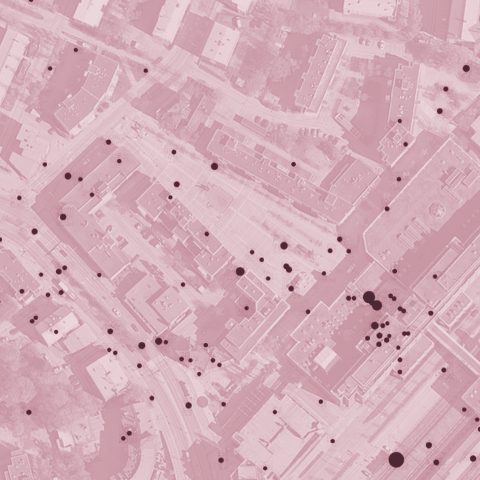
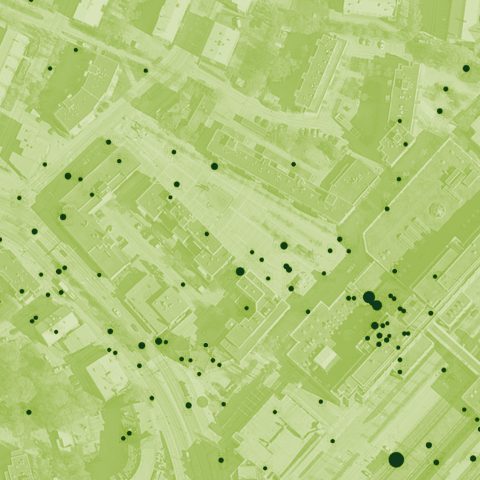
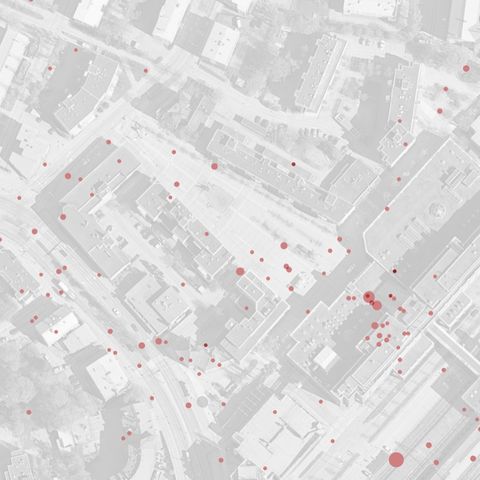
Experimentation Evaluation Toolkit — Ylä-Malmi Pilot
Only 9% of the photos analysed showed people socialising in the square, and just 1 in 100 any spontaneous use.
Green space, health and climateWe made:
Visions and co-designScale:
A whole cityFor:
Universities, culture and our own research
1
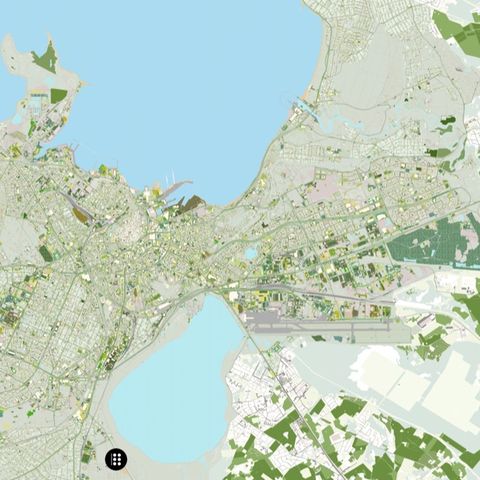
Tallinn 1.5 — A Plan for a Planetary City
Tallinn grows food on about 1% of its land; feeding the city on current diets would take about 20% (30 km²).
Public space and city lifeWe made:
Visions and co-designScale:
A street or a squareFor:
Universities, culture and our own research
none
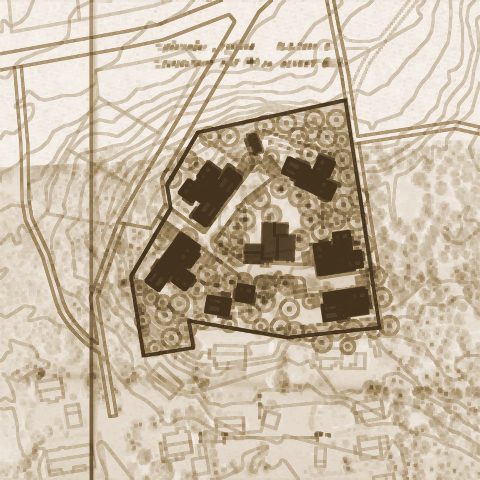
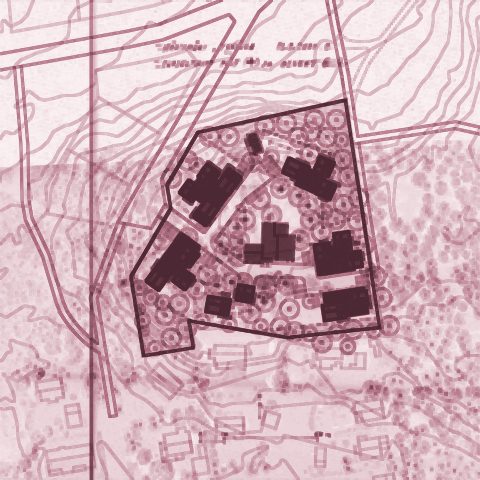
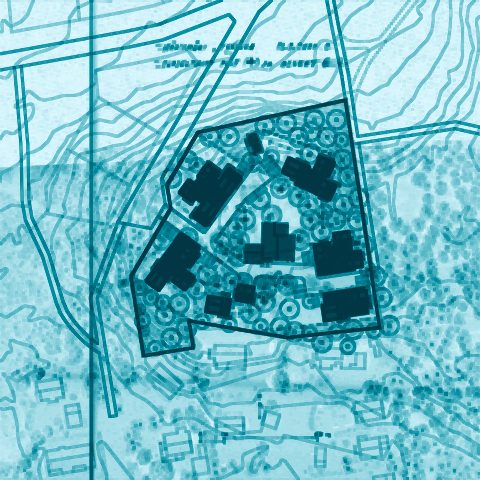
A Real Space
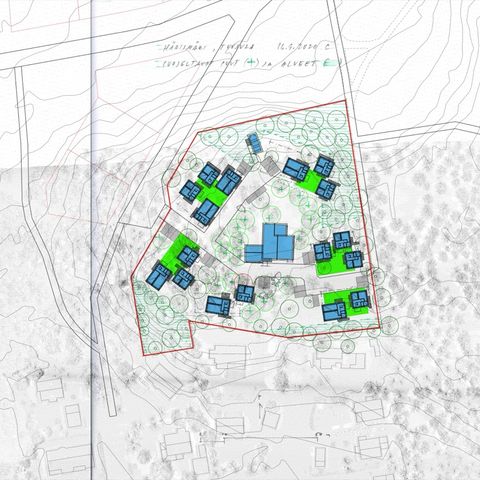
PlanningWe made:
Visions and co-designScale:
A district or a siteFor:
Cities and municipalities
none
Tuusula - Harismaki development plan
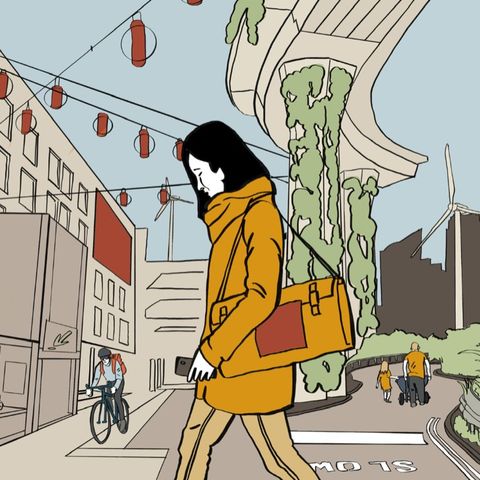
MobilityWe made:
AnalysesScale:
A region, a country or many citiesFor:
Cities and municipalities
5
The New Modal — Mobility Equity in Harju County
Public transport has about a 12% share of trips across most of Harju County, against 40% in Tallinn; the study ended in a handbook for closing that gap.
MobilityWe made:
AnalysesScale:
A region, a country or many citiesFor:
Cities and municipalities
1
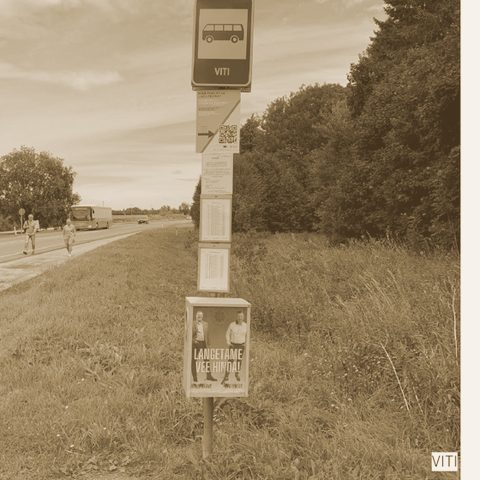
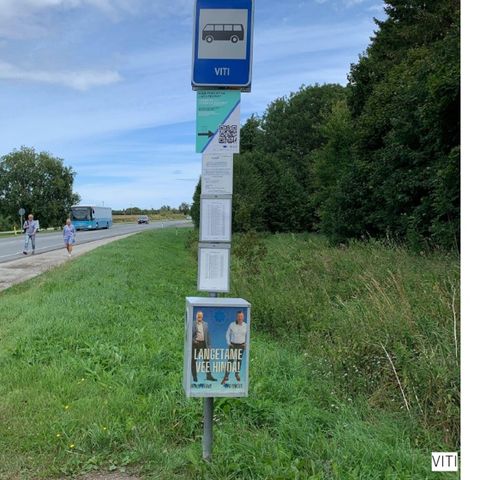
Kiida Peatust / Laida Peatust — Crowdsourced Bus Stop Survey
QR codes posted at 100 bus stops reached younger and Russian-speaking riders better than a social-media survey did.
MobilityWe made:
AnalysesScale:
A district or a siteFor:
Developers, companies and practices
1
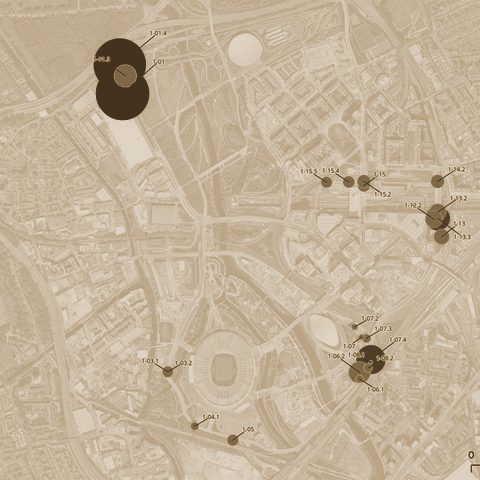
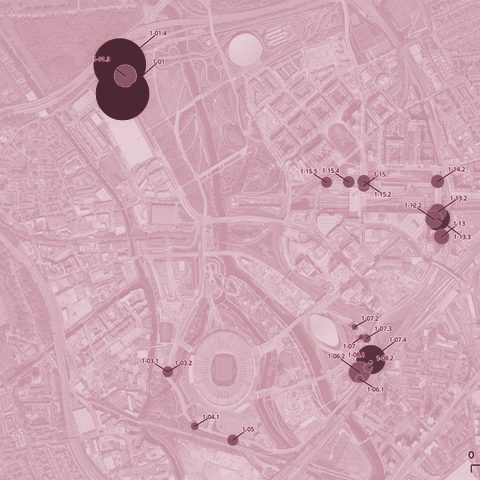
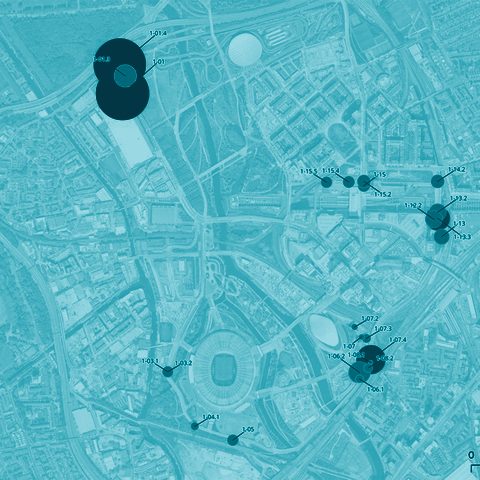
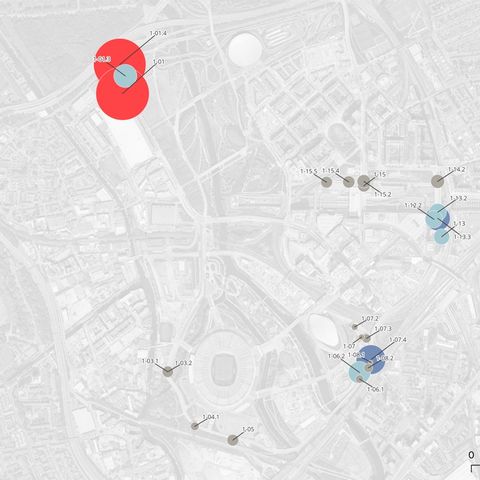
Mobility key performance indicators for Queen Elizabeth Olympic Park
Mobility measures for five areas around London’s Queen Elizabeth Olympic Park, read from the feeds of about 30 existing cameras, without storing any video.
Public space and city lifeWe made:
AnalysesScale:
A region, a country or many citiesFor:
Developers, companies and practices
none
Research on Female Entrepreneurship in Estonia
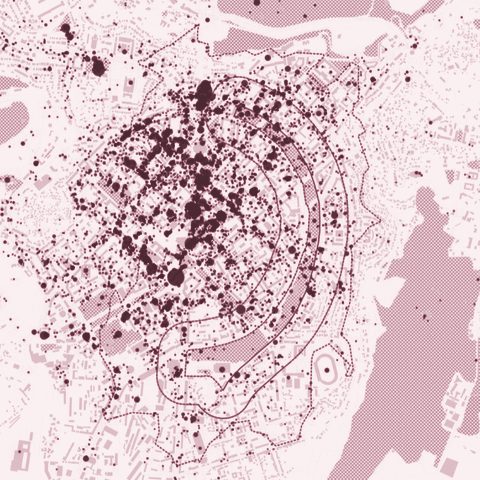
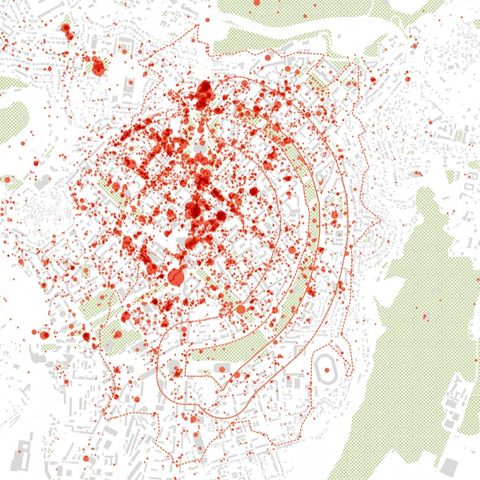
Public space and city lifeWe made:
AnalysesScale:
A street or a squareFor:
Ministries and public agencies
1
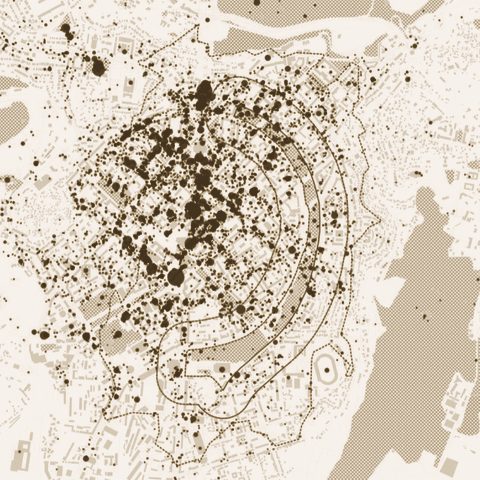
metaMorphology analysis of Yerevan Circular Park
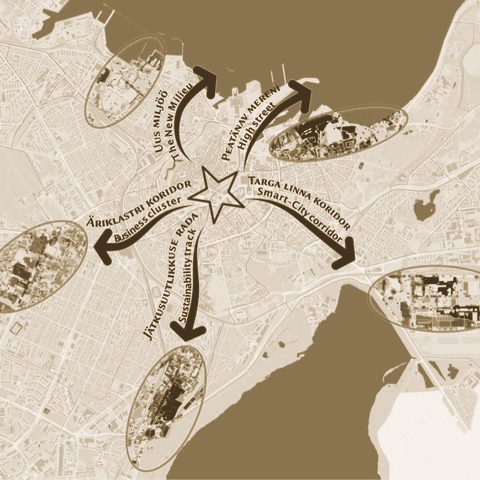
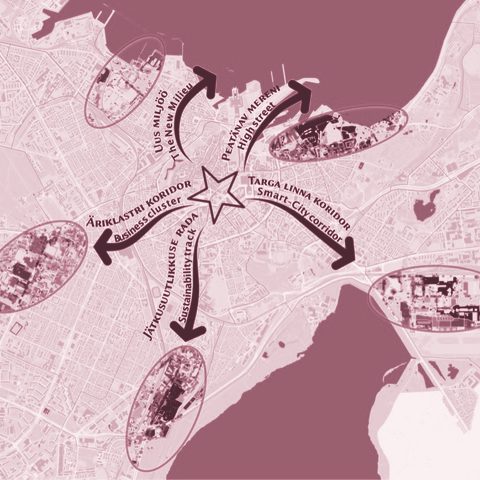
MobilityWe made:
AnalysesScale:
A district or a siteFor:
Cities and municipalities
5
metaYLE — Ülemiste Mobility Nudge
Widening the roads would push the car’s share of trips from 53% to 58%; putting public transport, walking and cycling first would bring it down to 20–30%.
Public space and city lifeWe made:
Data tools and platformsScale:
A region, a country or many citiesFor:
Developers, companies and practices
1
Ethical Use of Urban Data
Our own rules for handling urban data, taught as a workshop: data that looks anonymous can still identify a person.

PlanningWe made:
Policy reviews and blueprintsScale:
A district or a siteFor:
Cities and municipalities
2
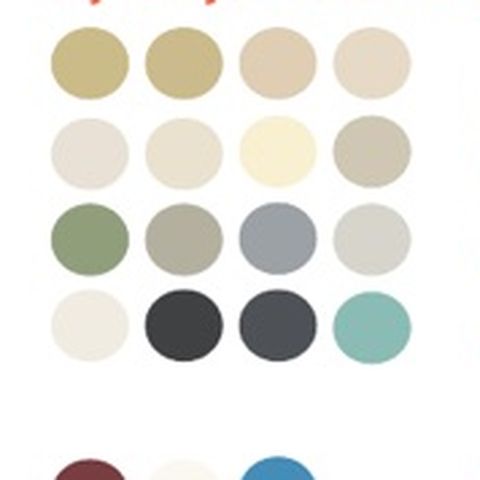
Nikkilä Colour Analysis
Building colours read by computer vision from about 360 street photos of Nikkilä, turned into colour codes for repairs, infill and new buildings.
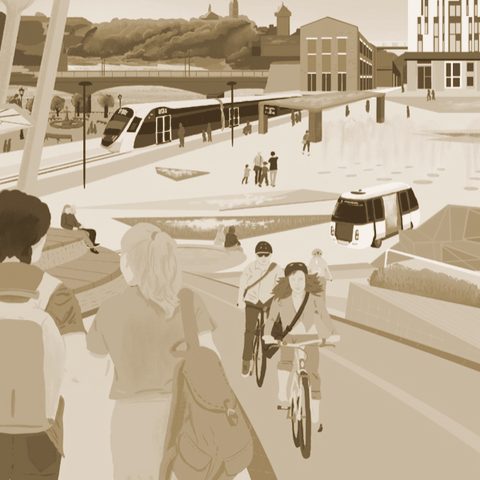
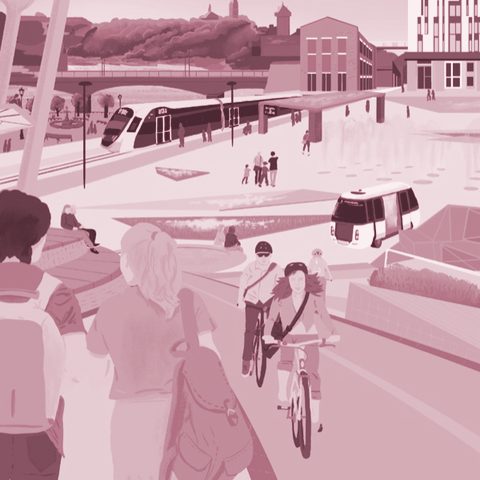
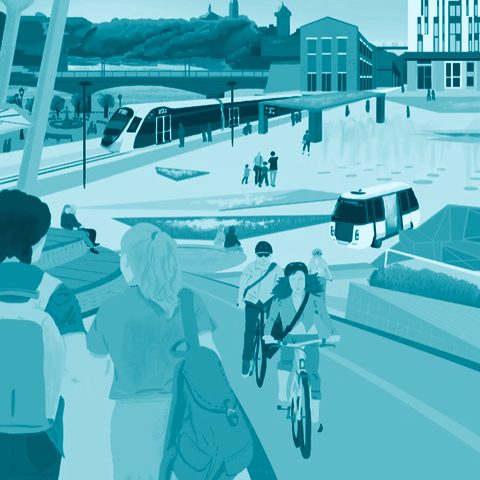
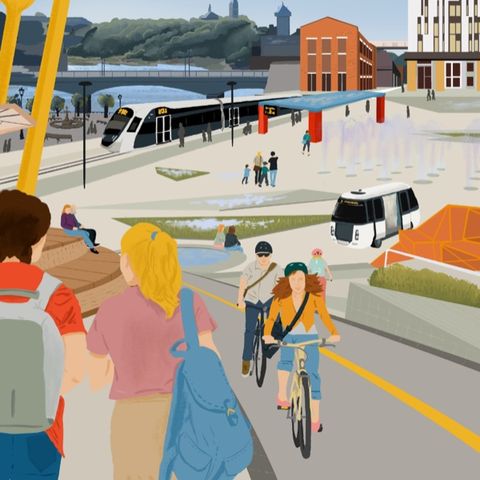
Public space and city lifeWe made:
Visions and co-designScale:
A whole cityFor:
Cities and municipalities
2
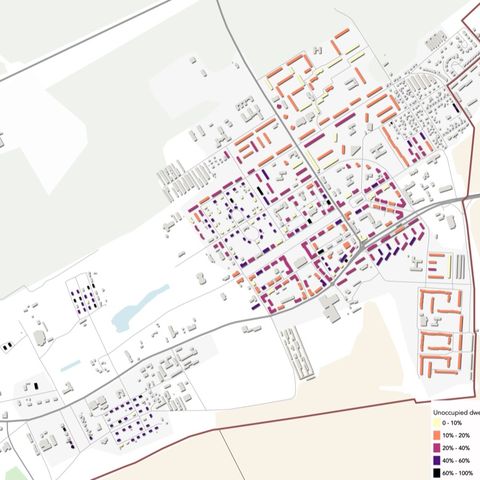
ReCenter Narva — Youth Vision for Narva 2035
305 people, 60% of them under 30, mapped Narva: the river promenade, old town and city centre are the places they like most.
PlanningWe made:
AnalysesScale:
A region, a country or many citiesFor:
Ministries and public agencies
3
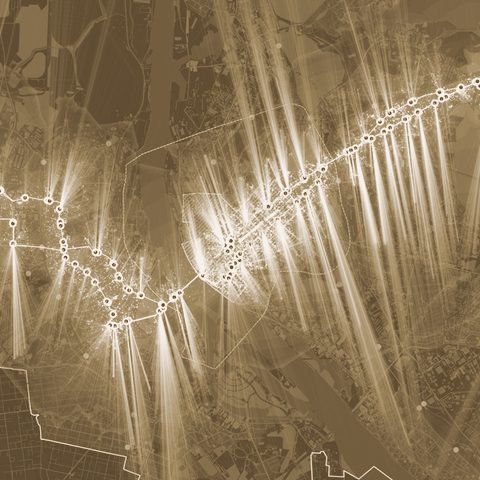
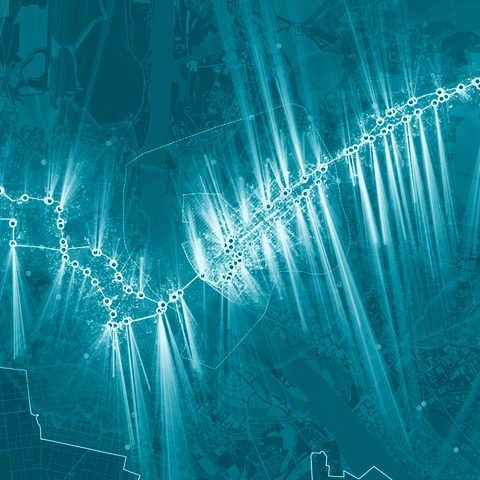
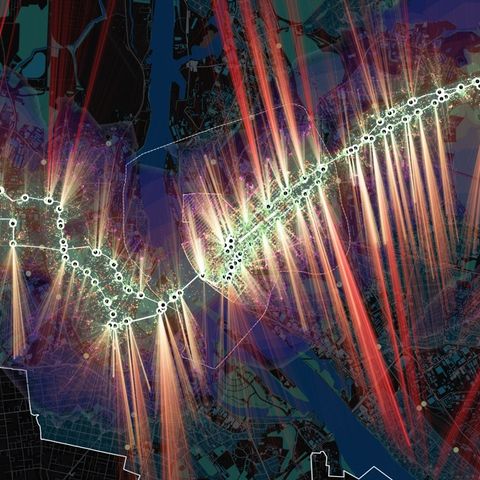
A Research Pilot for Shrinking Cities
In the pilot area in Ida-Viru County, building vacancy reached 25%, and the empty buildings clustered together rather than spreading evenly.
MobilityWe made:
AnalysesScale:
A whole cityFor:
Developers, companies and practices
none
Riga Mobility Metrics
About 98,500 of Riga’s residents live within 300 m of a bus or tram stop; each further 300 m band holds only 22,000–37,000.
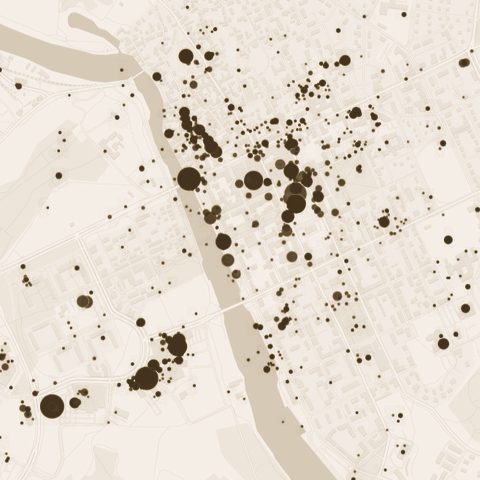
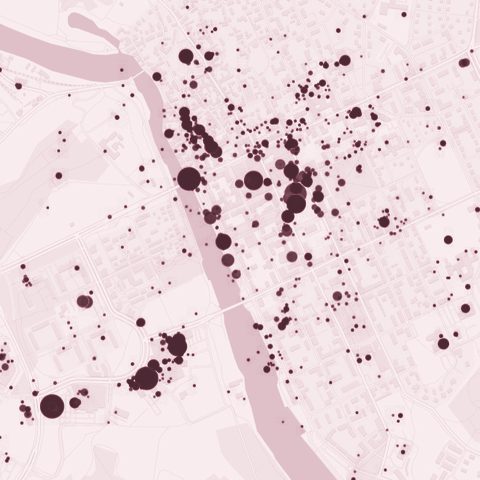
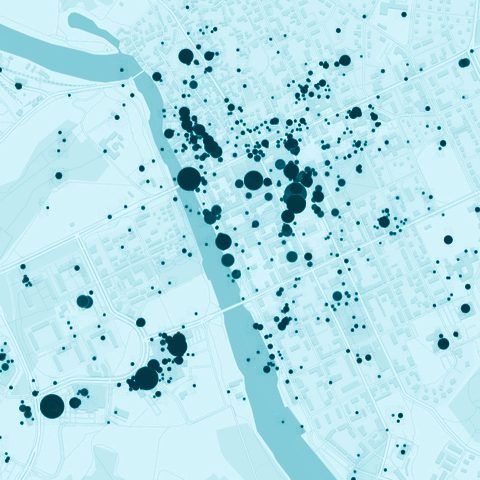
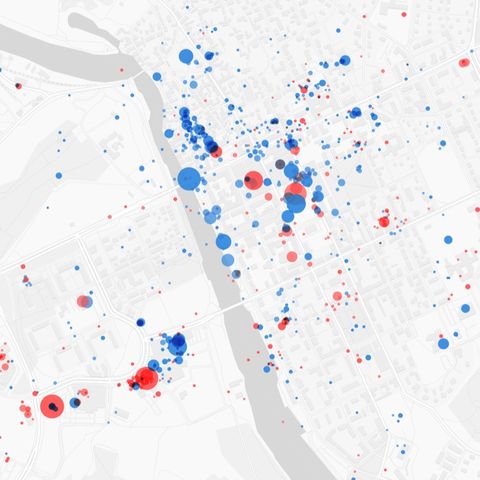
Public space and city lifeWe made:
AnalysesScale:
A street or a squareFor:
Developers, companies and practices
1
Porvoo Square Benchmark
Before its redesign, the square was already the most visited place in Porvoo, with 3,687 check-ins.
PlanningWe made:
AnalysesScale:
A whole cityFor:
Cities and municipalities
none
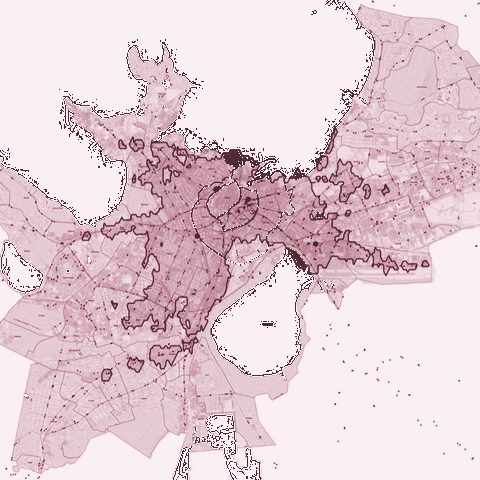
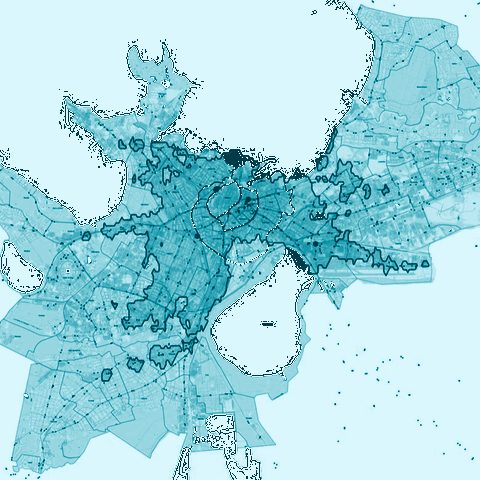
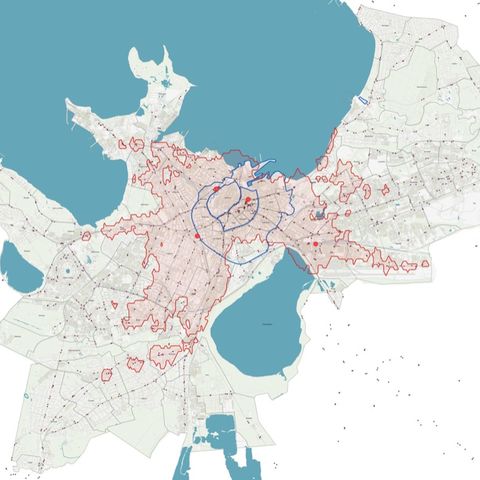
Warsaw Spatial Development Scenarios
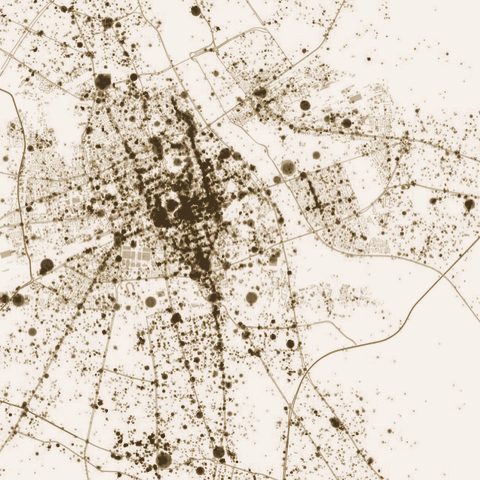
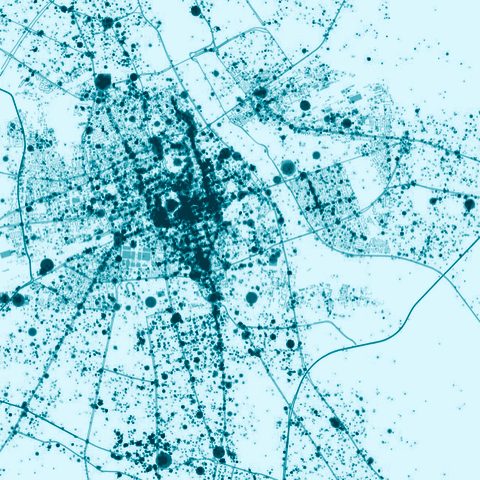
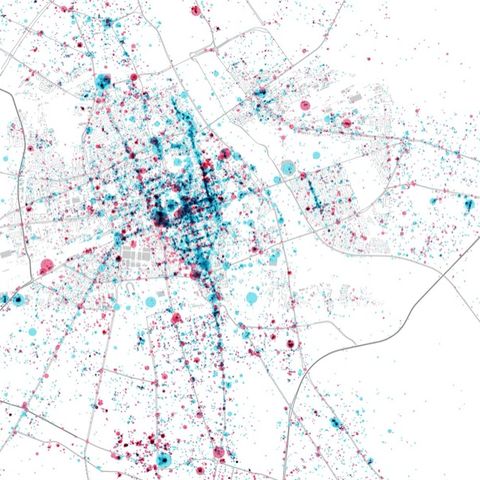
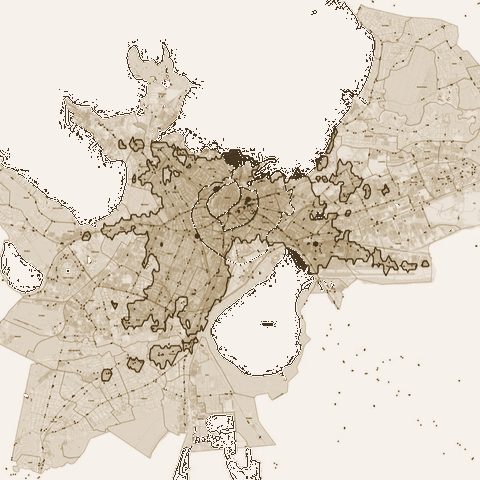
For Warsaw’s new spatial strategy, about 48,000 places listed on Foursquare show activity running in long strips along arterial roads, not in central blocks.
MobilityWe made:
Policy reviews and blueprintsScale:
A whole cityFor:
Cities and municipalities
5
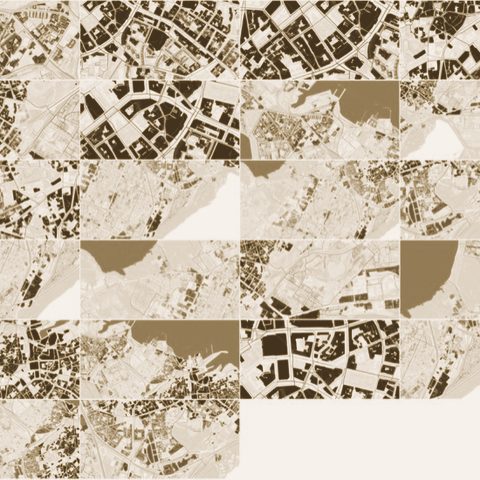
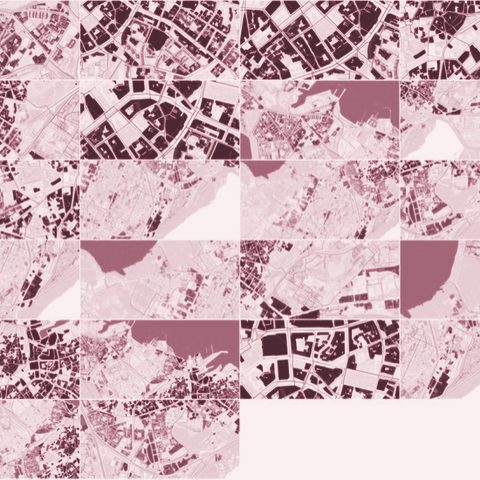
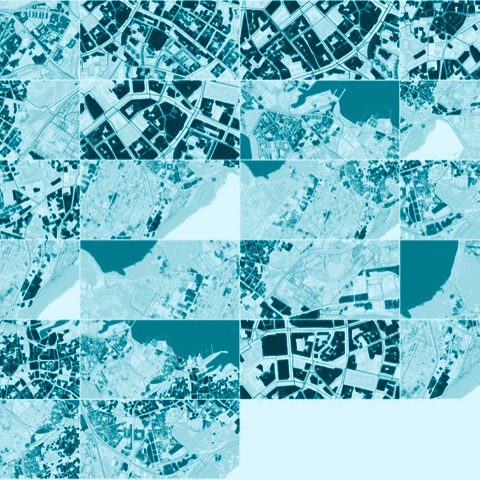
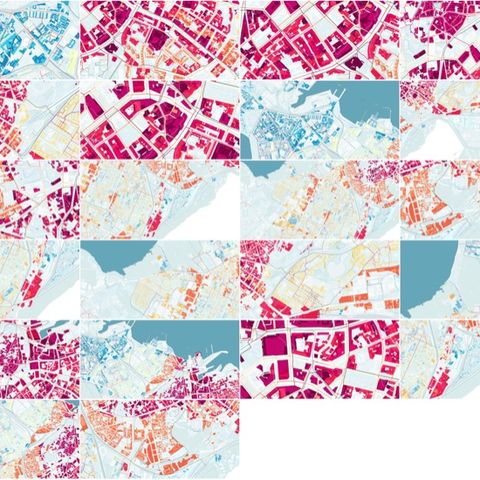
metaPARK — Performance-Based Parking Policy for Tallinn
The study proposed tying the price of parking to public transport: where transit is fast and convenient, you pay to park.
PlanningWe made:
AnalysesScale:
A district or a siteFor:
Cities and municipalities
2
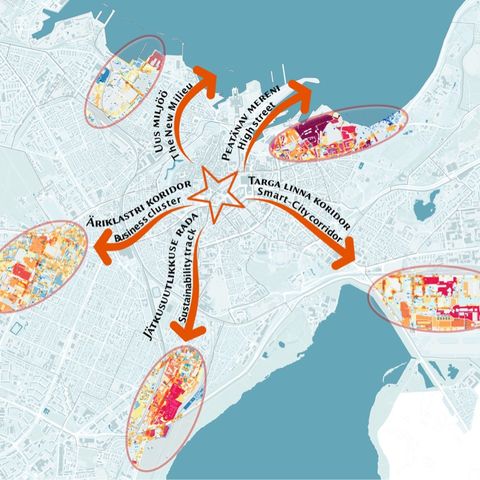
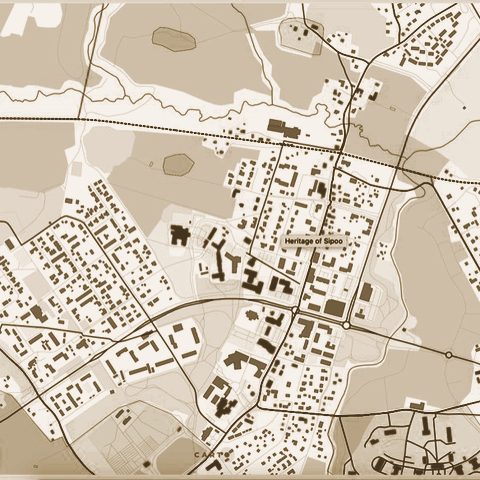
metaLINN - Tallinn City Center Development study
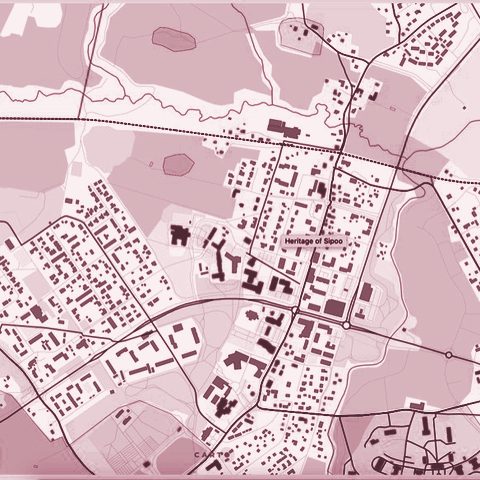
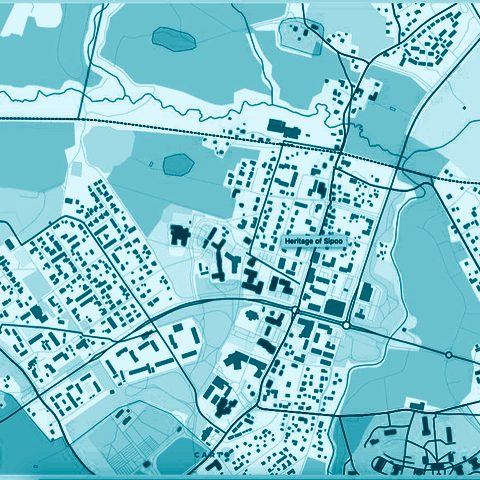
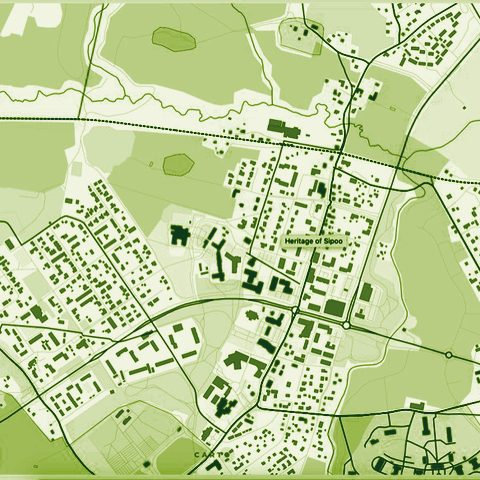
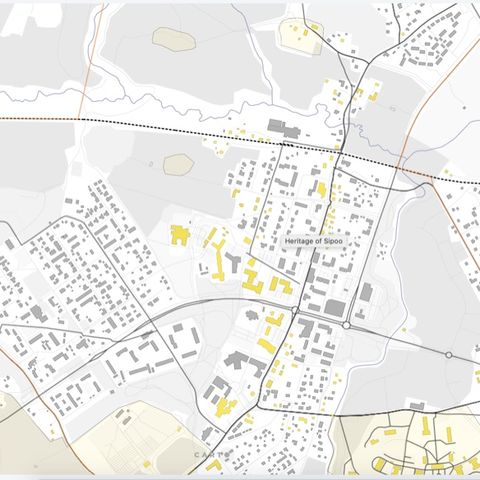
PlanningWe made:
Data tools and platformsScale:
A district or a siteFor:
Cities and municipalities
none
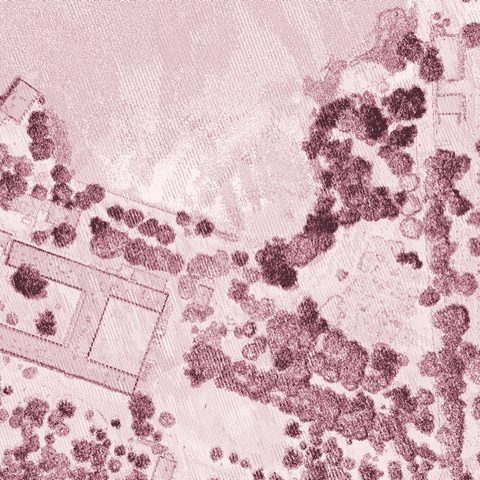
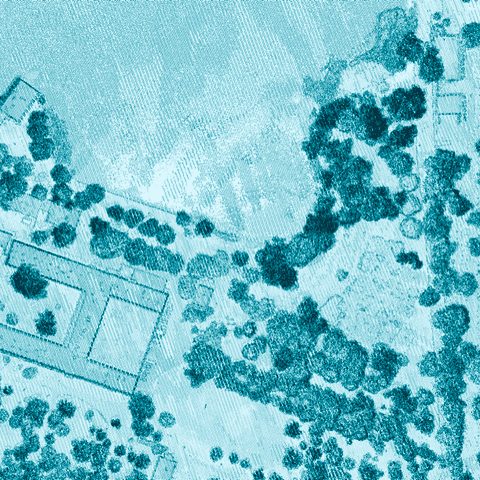
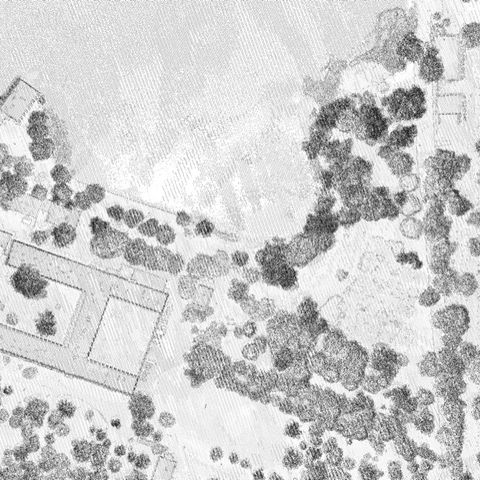
Heritage of Sipoo — Typomorphology Map
Nikkilä’s 99 listed buildings are graded A, B or C by heritage value, on a public map anyone can filter.
PlanningWe made:
Visions and co-designScale:
A district or a siteFor:
Developers, companies and practices
none
Lapinlahti 360 competition entry support
PlanningWe made:
Policy reviews and blueprintsScale:
A region, a country or many citiesFor:
Ministries and public agencies
5
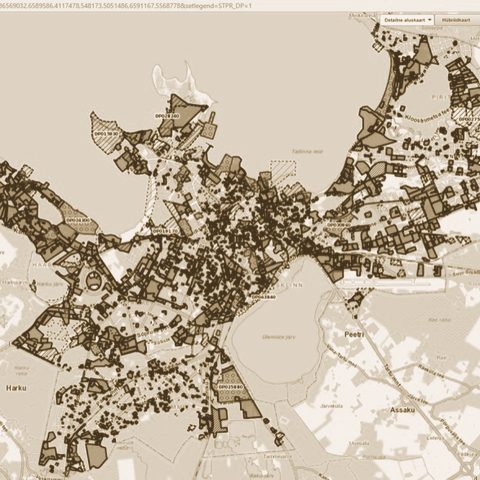
Vision for Land Use Monitoring — Finnish Ministry of the Environment
Monitoring Finland’s zoning plans with the old standard forms cost about €130,000 a year; of three costed options, automated monitoring from digital plans was the most cost-effective.
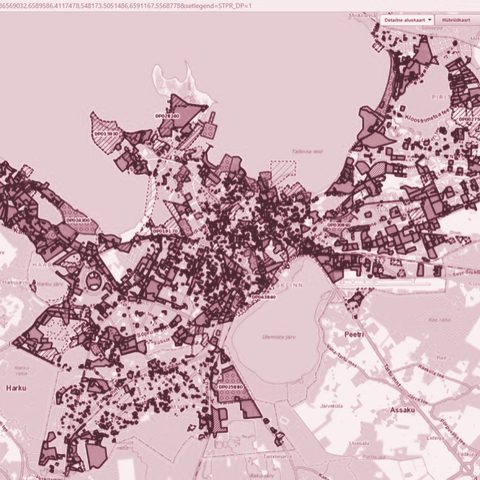
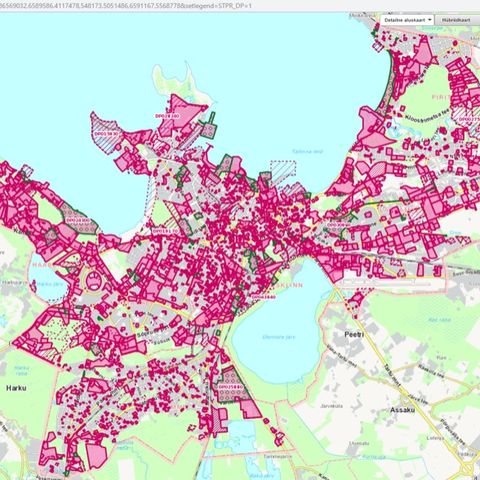
PlanningWe made:
AnalysesScale:
A district or a siteFor:
Universities, culture and our own research
1
metaLINN+8 — Unfinished City
143 measures, combined into scores for space, activity and values, applied to seven leftover areas of Tallinn.
MobilityWe made:
Visions and co-designScale:
A whole cityFor:
Developers, companies and practices
1
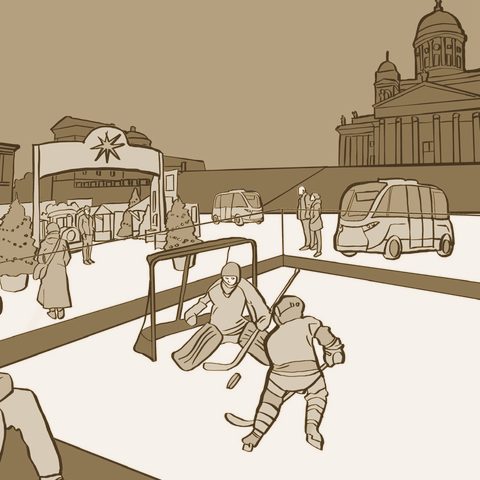
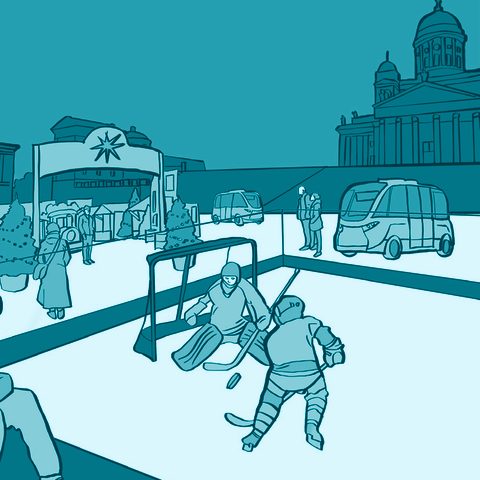
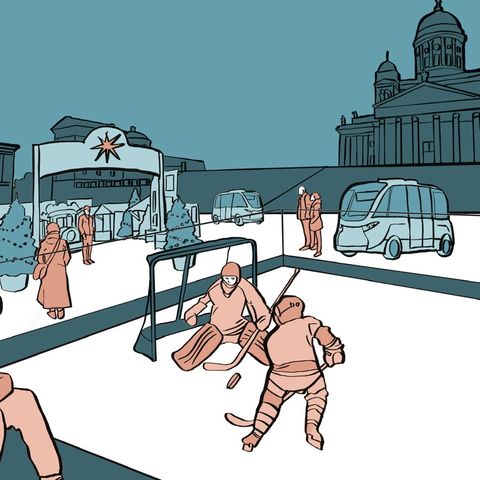
New Futurama
A 2035 vision for Helsinki that answers climate change through mobility, freeing land now given to roads and parking.
Public space and city lifeWe made:
AnalysesScale:
A region, a country or many citiesFor:
Universities, culture and our own research
none
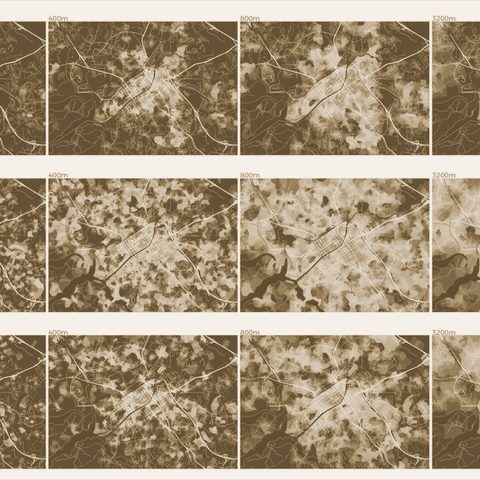
Mapping Twitter activity in the Baltic Sea region
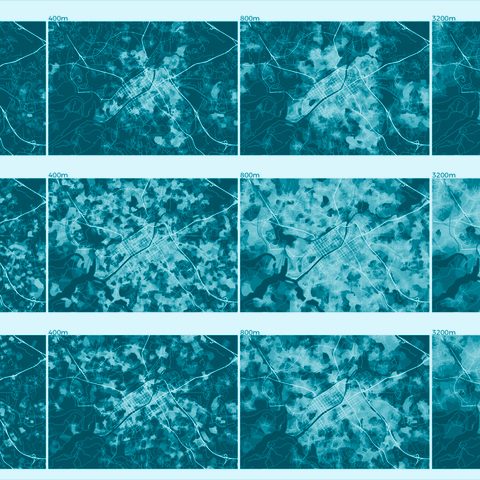
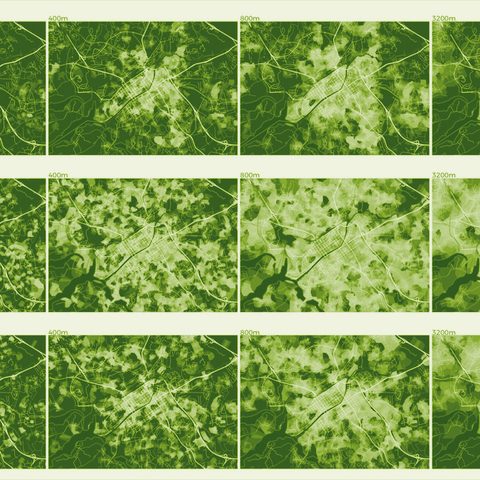
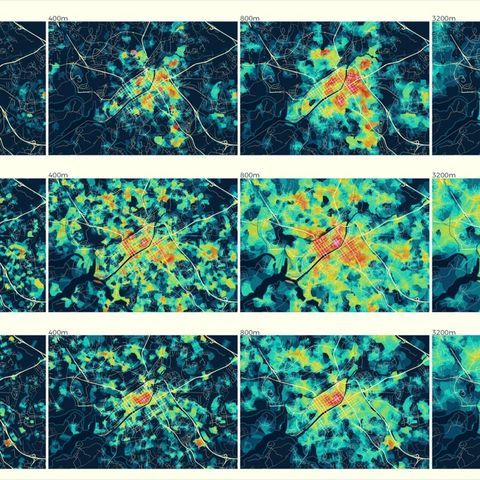
PlanningWe made:
Data tools and platformsScale:
A whole cityFor:
Cities and municipalities
2
Turku Open Platform (TOP)
A desktop app for the city’s own staff to compare areas of Turku by space, activities and values, delivered to the city on 6 November 2018.
Public space and city lifeWe made:
AnalysesScale:
A whole cityFor:
Universities, culture and our own research
none
Helsinki night life
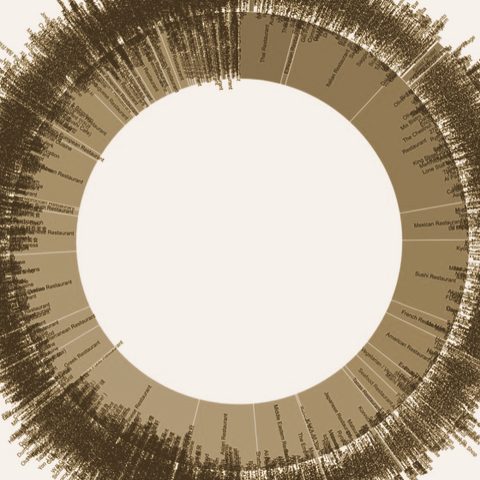
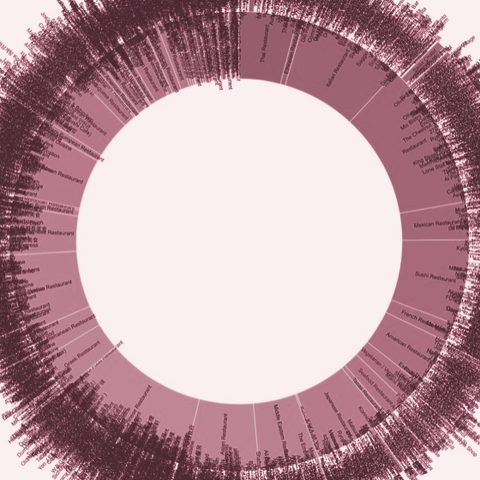
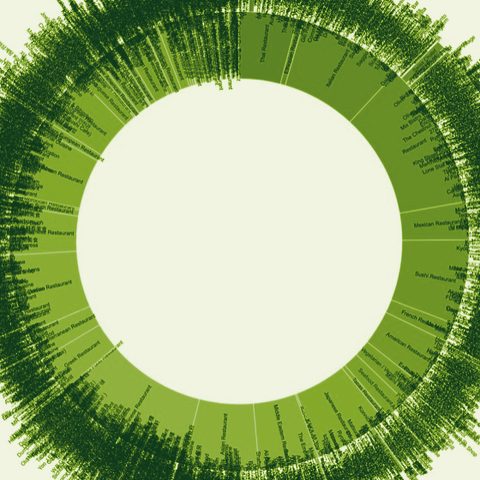
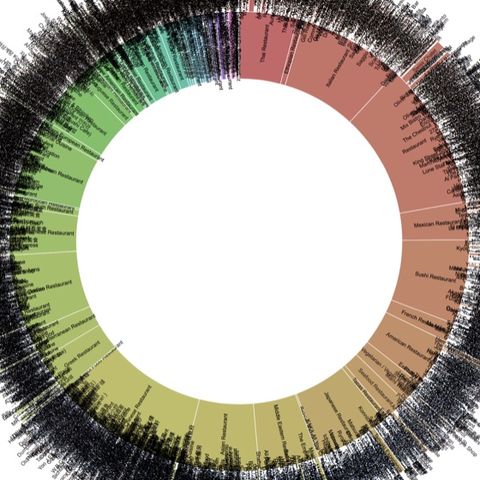
Public space and city lifeWe made:
AnalysesScale:
A region, a country or many citiesFor:
Universities, culture and our own research
1
metaMorphology analysis of GTA Toronto
Public space and city lifeWe made:
AnalysesScale:
A whole cityFor:
Universities, culture and our own research
none
Dogs' map of Helsinki
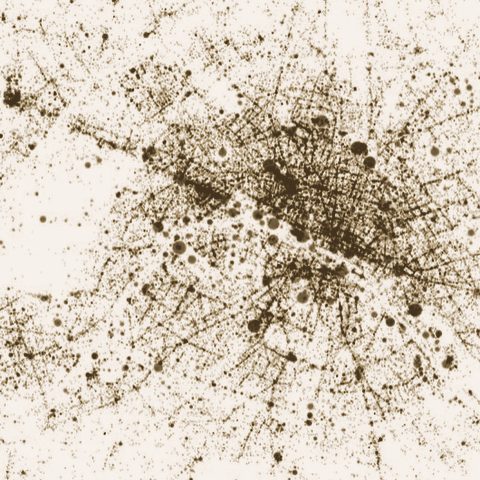
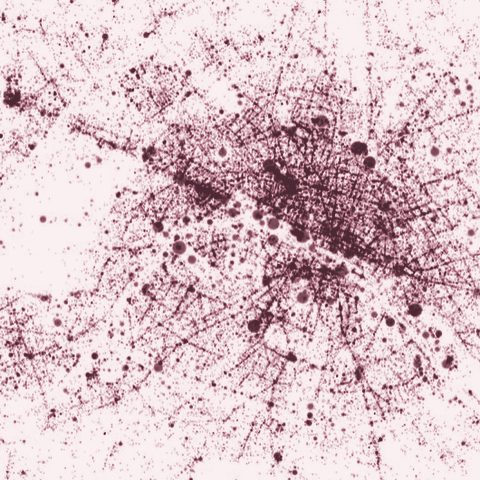
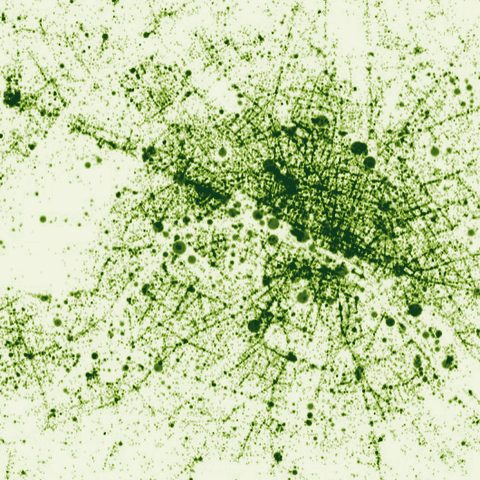
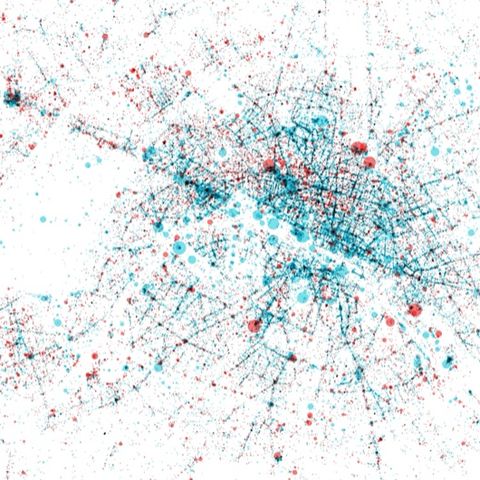
Public space and city lifeWe made:
AnalysesScale:
A region, a country or many citiesFor:
Universities, culture and our own research
none
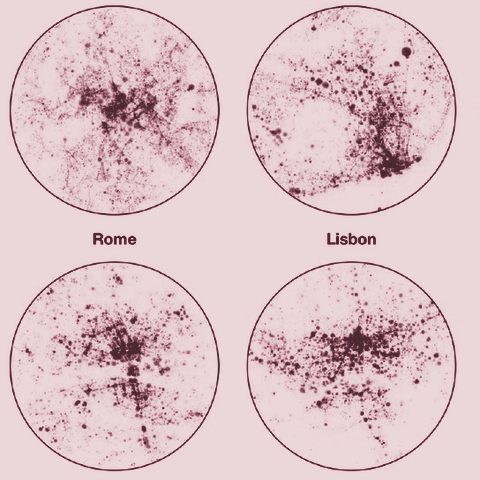
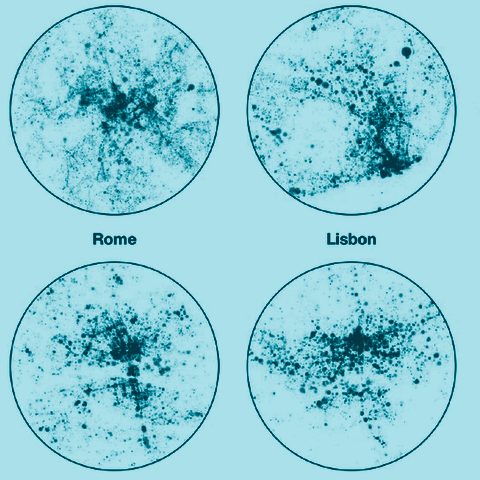
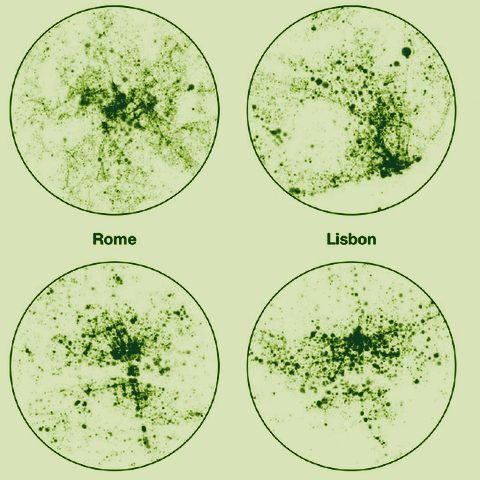
EU cities activities entropy scaling
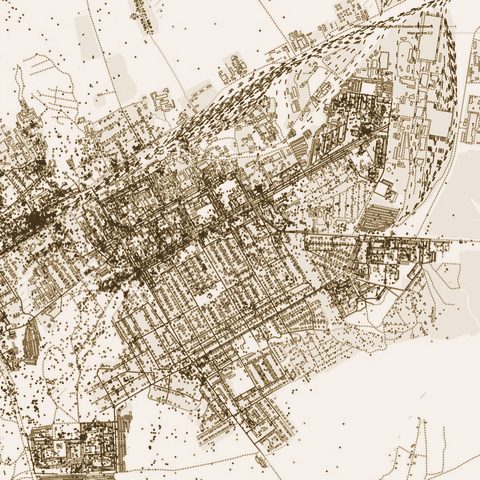
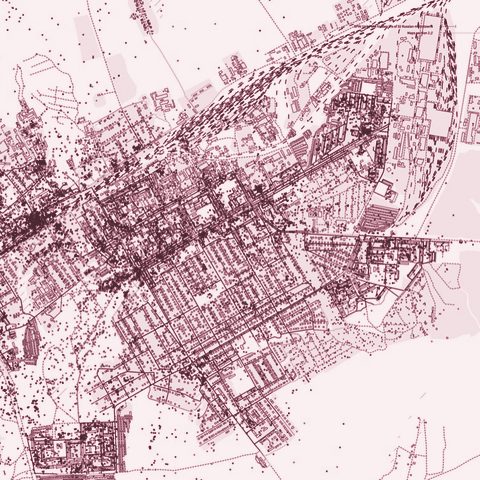
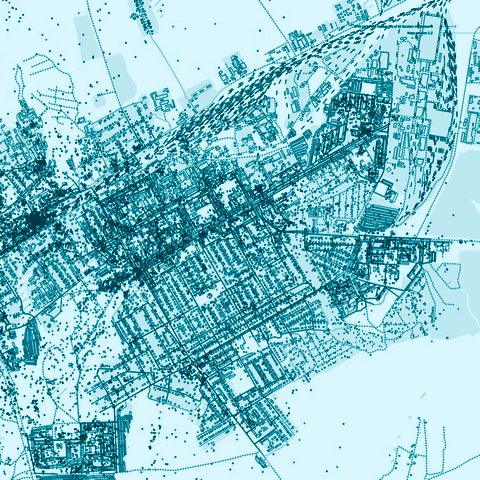
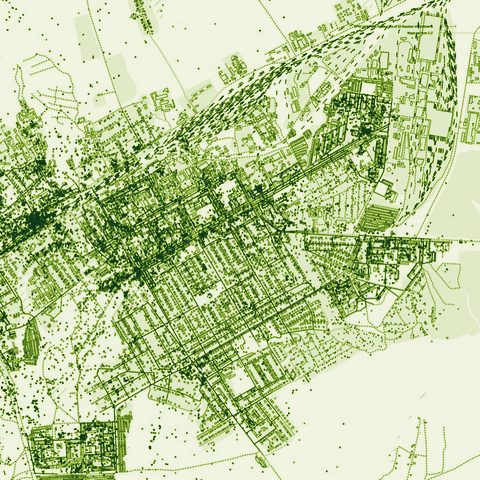
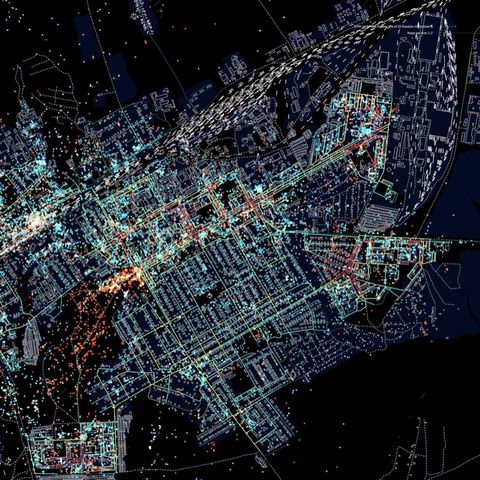
Public space and city lifeWe made:
AnalysesScale:
A region, a country or many citiesFor:
Developers, companies and practices
1
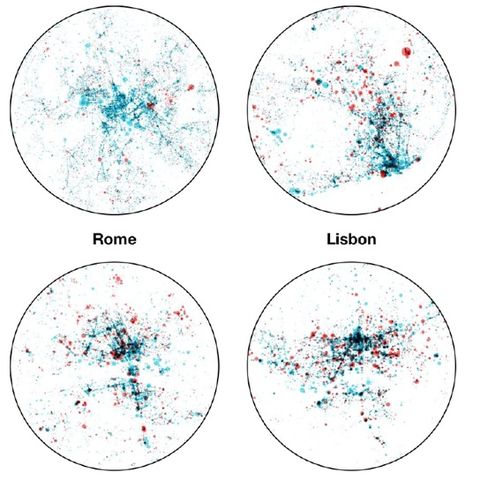
The Hidden Life of 32 Russian Monotowns
In residents’ own photos of 32 single-industry towns, family life dominates; cafés, restaurants and nightlife are largely absent.
Public space and city lifeWe made:
AnalysesScale:
A region, a country or many citiesFor:
Developers, companies and practices
none
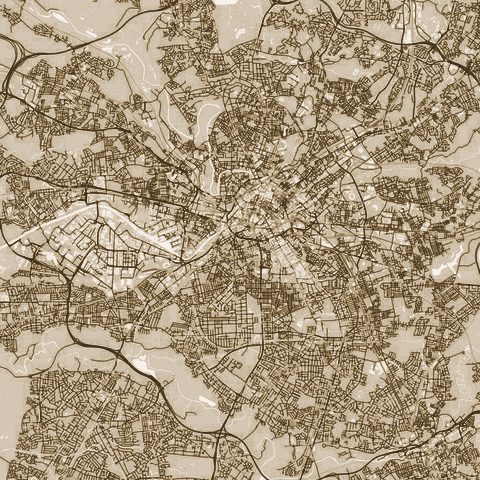
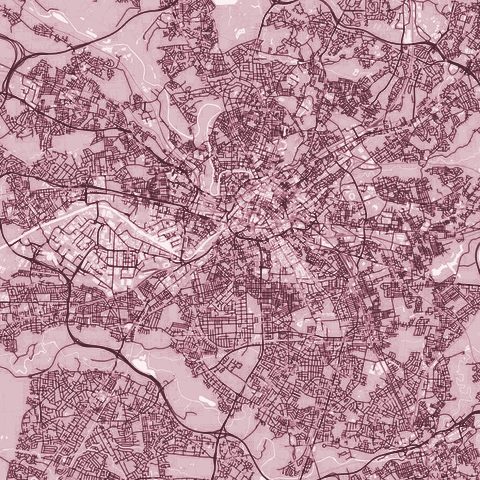
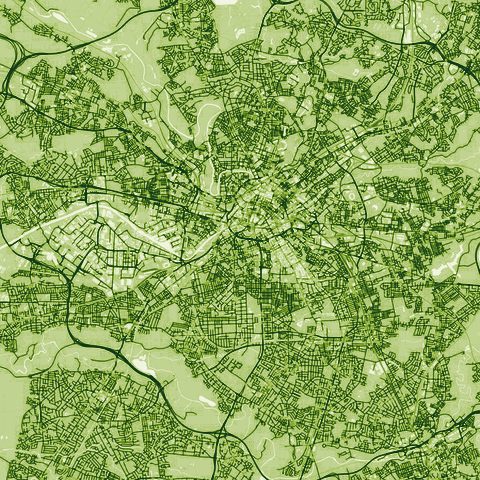
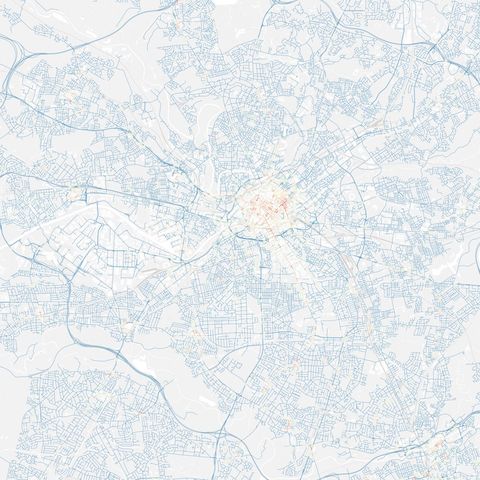
The Hidden Life of 38 Cities — World Cup 2018 Heritage
Roughly 2.5–3 million geolocated posts from 38 Russian cities; in the tagged sample only 7% read as unsafe.
Public space and city lifeWe made:
AnalysesScale:
A district or a siteFor:
Universities, culture and our own research
1
MediaCityUK Activity Analysis
What MediaCityUK offers set against what people do there, read from venues and roughly 9,200 geotagged photos.
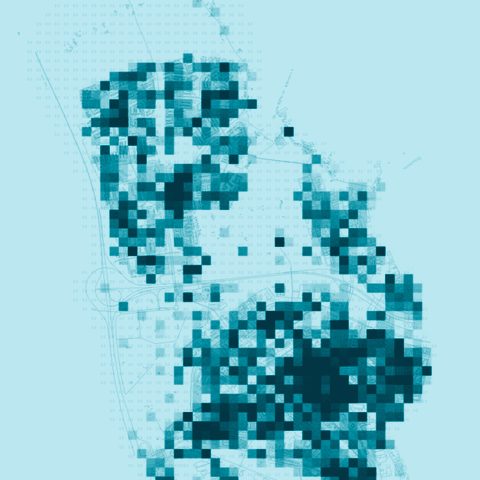
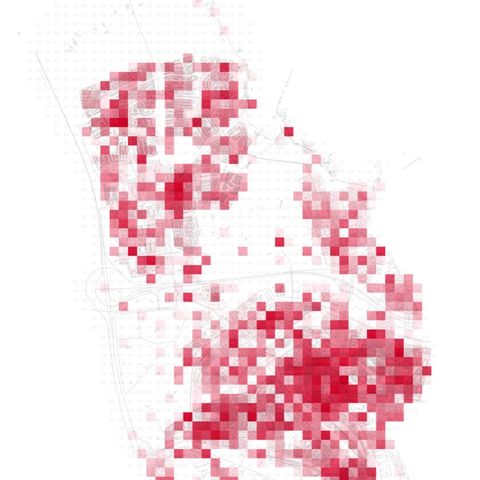
PlanningWe made:
Visions and co-designScale:
A whole cityFor:
Developers, companies and practices
1
Voorbij de Winkelstraat — Schiedam
As Schiedam’s shopping streets emptied, the study read over 7,000 Instagram photos and check-in data to propose new uses for three underused sites.
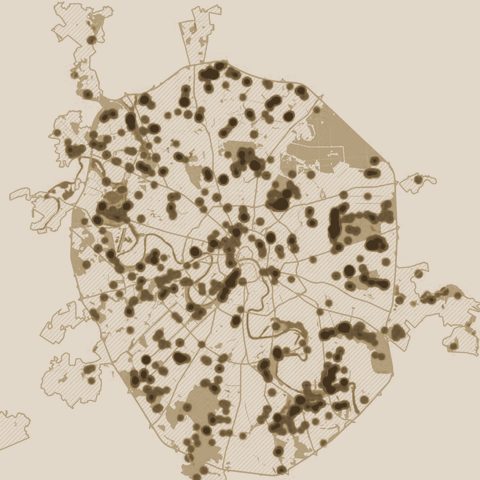
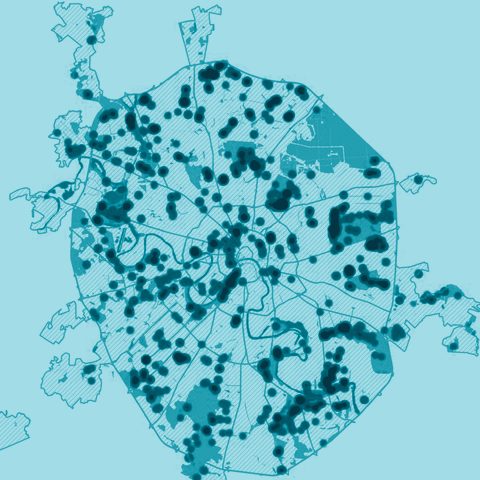
Green space, health and climateWe made:
AnalysesScale:
A whole cityFor:
Developers, companies and practices
1
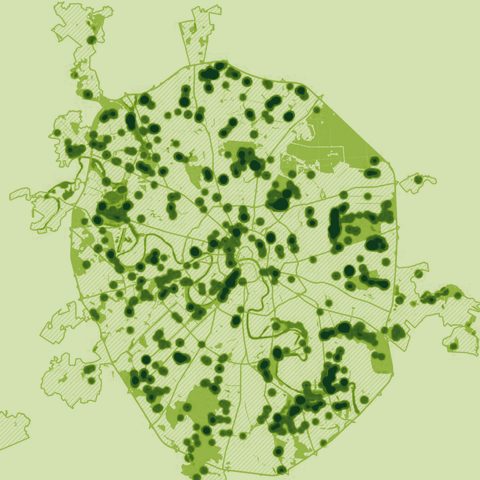
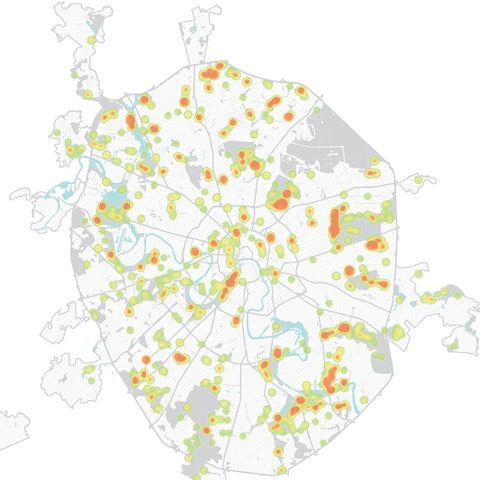
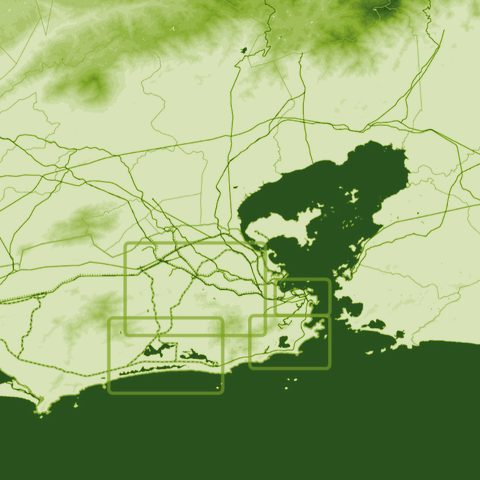
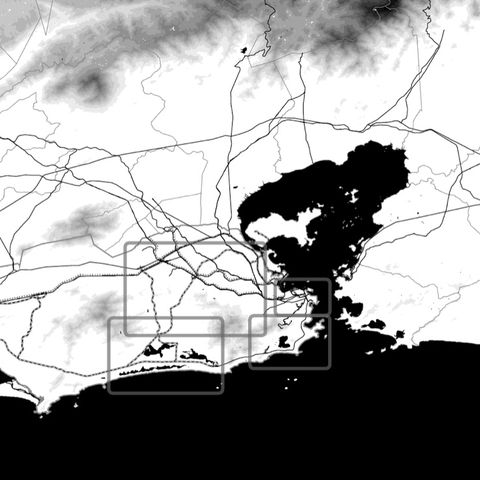
Moscow Green & Water Accessibility Analysis
Most of Moscow has green space within walking reach; the barrier is a disconnected street network, and the busiest walking routes mostly pass the parks by.
PlanningWe made:
AnalysesScale:
A whole cityFor:
Universities, culture and our own research
1
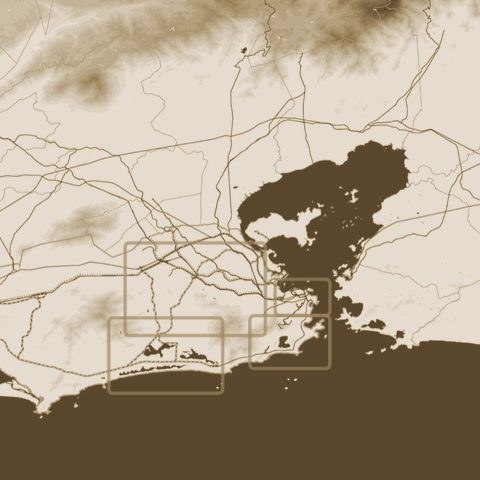
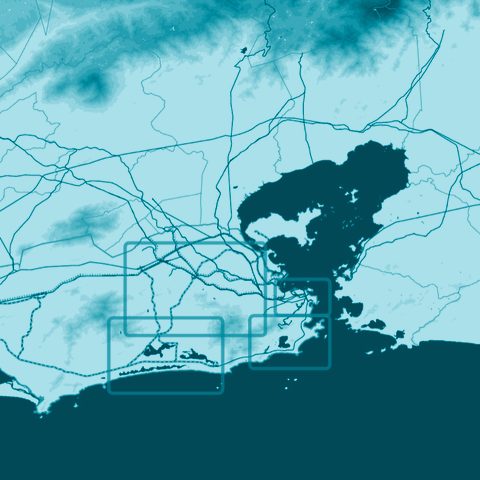
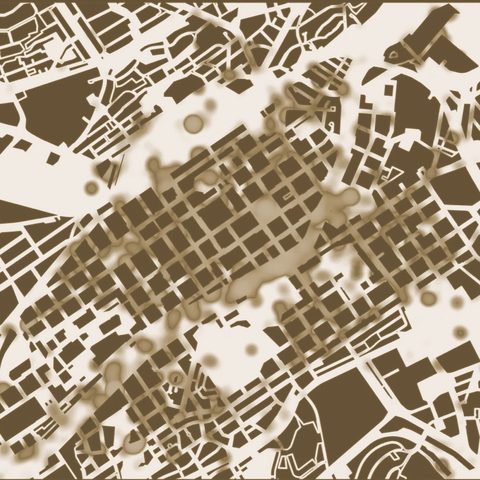
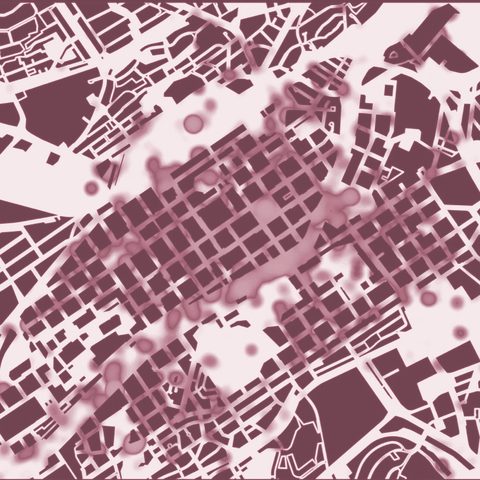
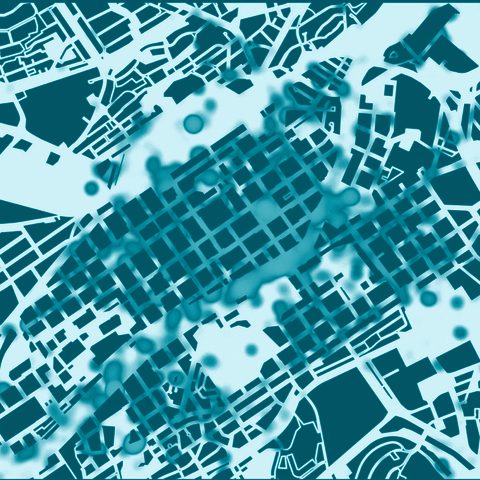
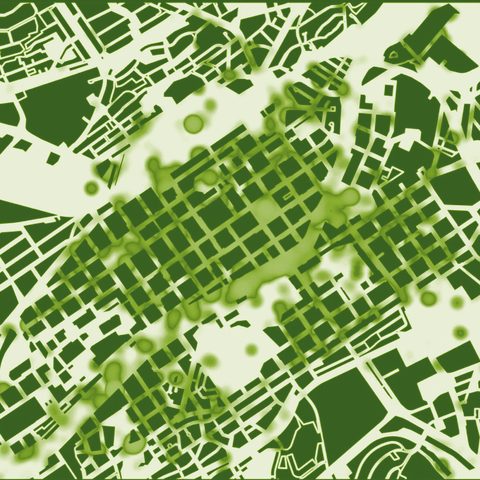
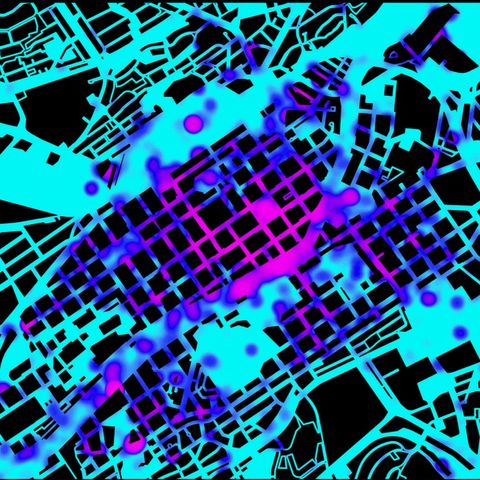
Rio de Janeiro Olympic Urbanism Maps
A series of six maps, at four nested scales, that places the Olympic venues and the informal settlements side by side.
Public space and city lifeWe made:
AnalysesScale:
A whole cityFor:
Universities, culture and our own research
1
A Sense of Place
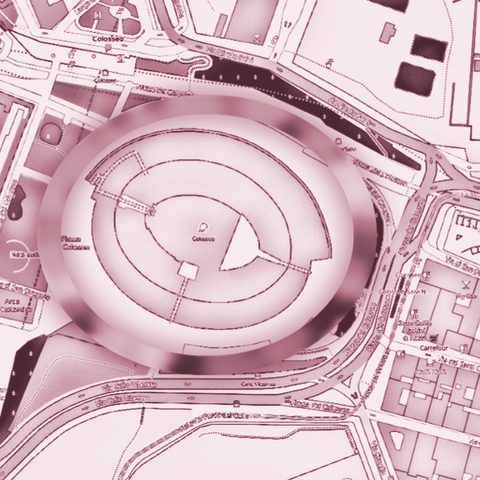
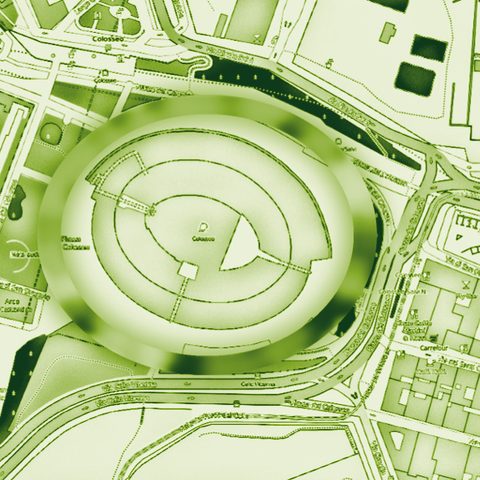
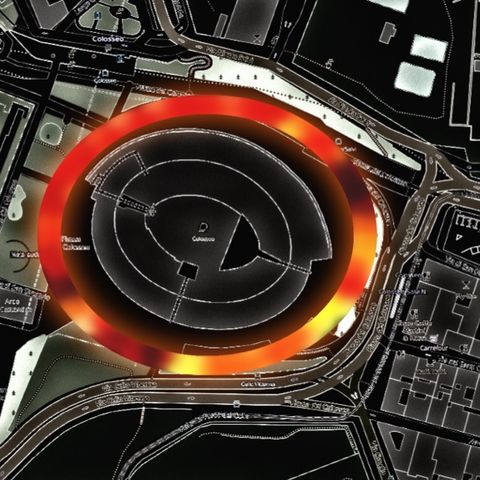
Public space and city lifeWe made:
AnalysesScale:
A street or a squareFor:
Universities, culture and our own research
none
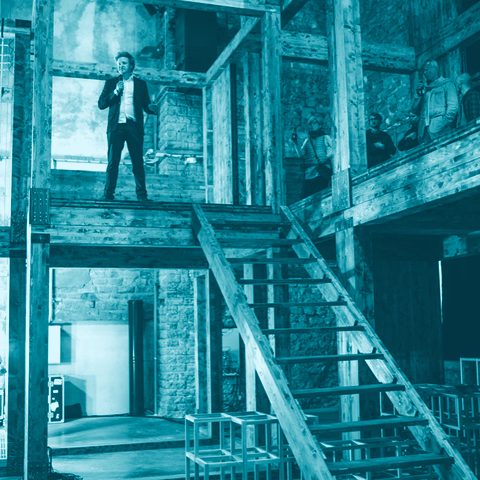
Colosseum Night Lighting Map
A map of night lighting around the Colosseum, from 4 to 180 lux, measured from a cart carrying a lux meter and GPS.
PlanningWe made:
Visions and co-designScale:
A whole cityFor:
Universities, culture and our own research
none
TAB-Lab — Tallinn Architecture Biennale 2015
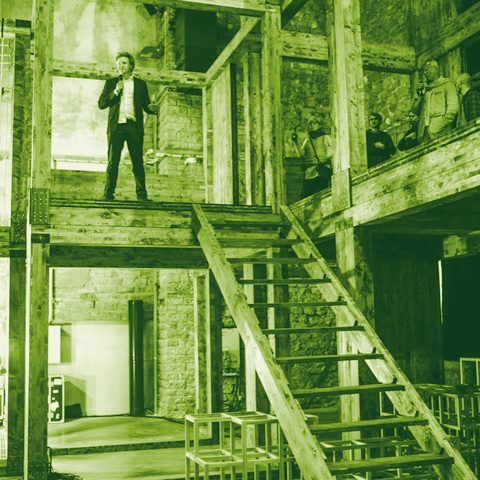
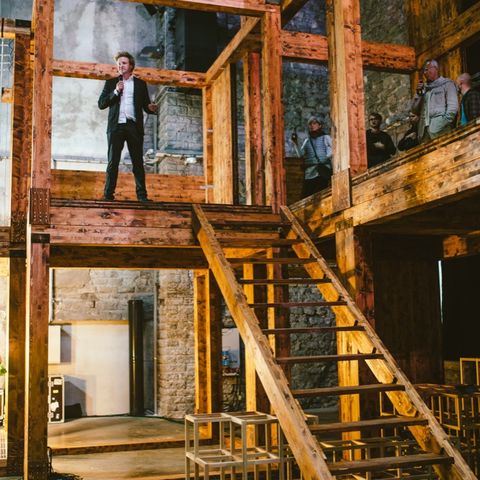
SPIN Unit’s founders curated the research strand of the 2015 Tallinn Architecture Biennale, in a former power plant.
MobilityWe made:
AnalysesScale:
A whole cityFor:
Universities, culture and our own research
none
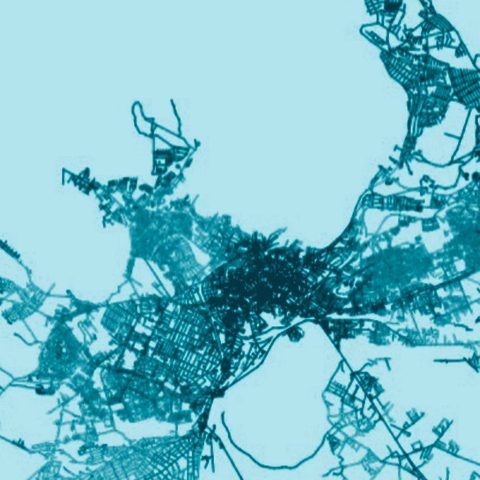
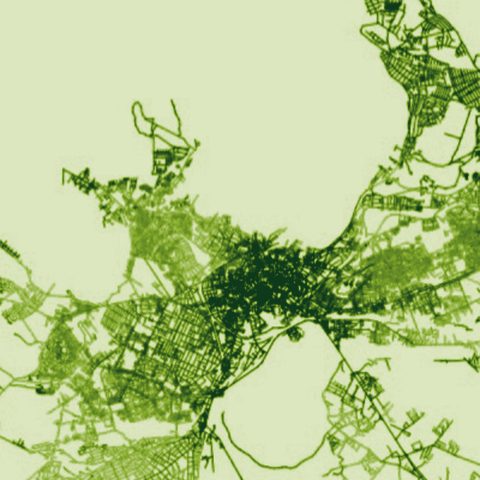
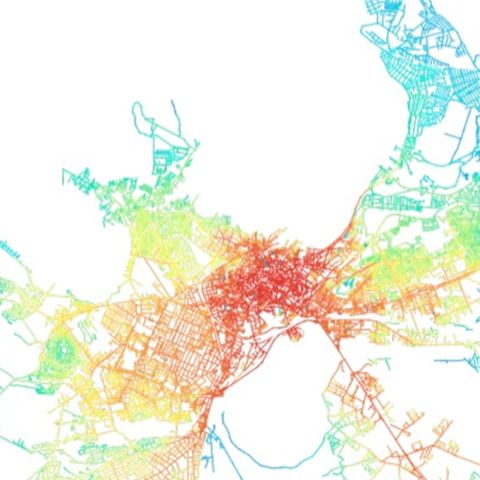
Tallinn cycling patterns
Public space and city lifeWe made:
AnalysesScale:
A whole cityFor:
Universities, culture and our own research
2
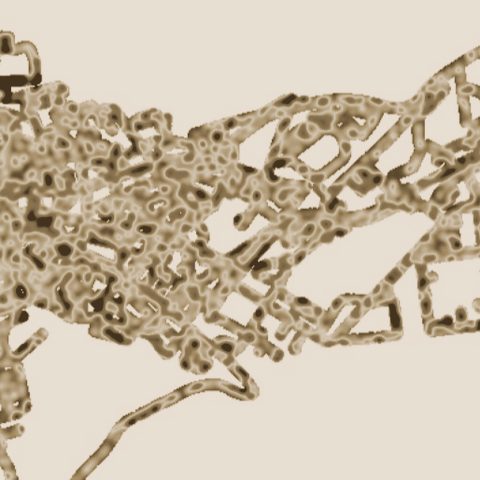
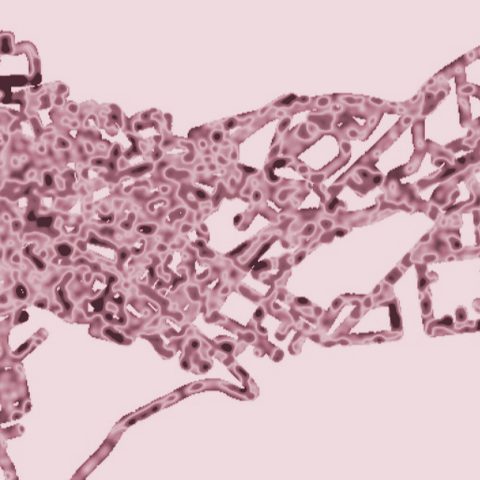
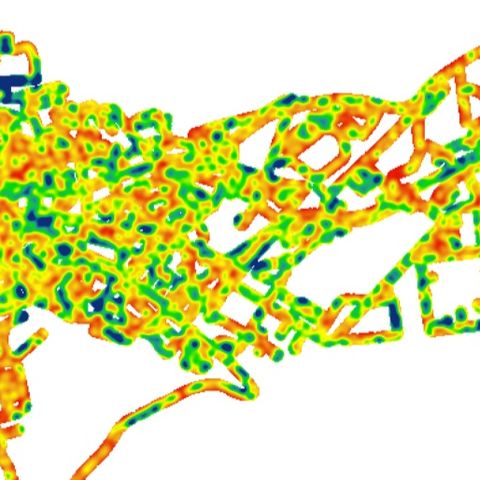
Crime, Society and Urban Design (crime prevention through environmental design)
More than 33,000 light readings across central Tallinn: better-connected streets are better lit.
Public space and city lifeWe made:
AnalysesScale:
A whole cityFor:
Universities, culture and our own research
1
From Ballroom to Dead End — Tallinn Night Map
A home-built light sensor, driven and cycled through Tallinn at night, logged 33,581 readings to test whether better-connected streets are better lit.
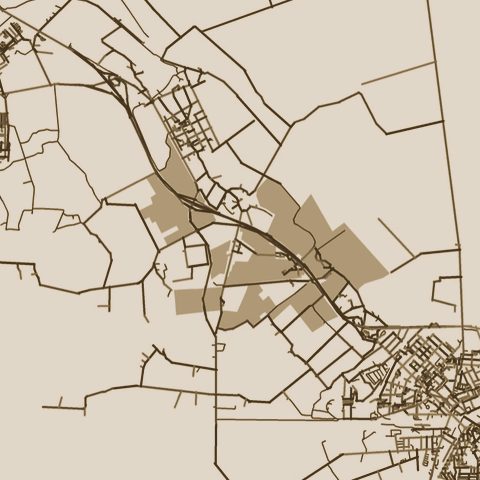
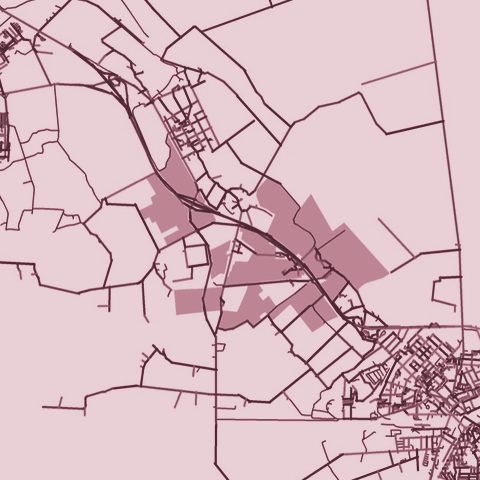
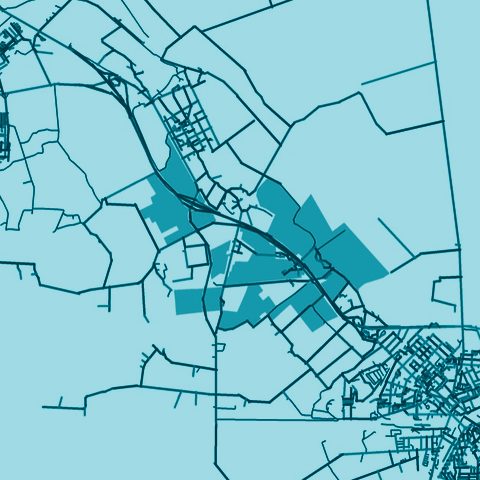
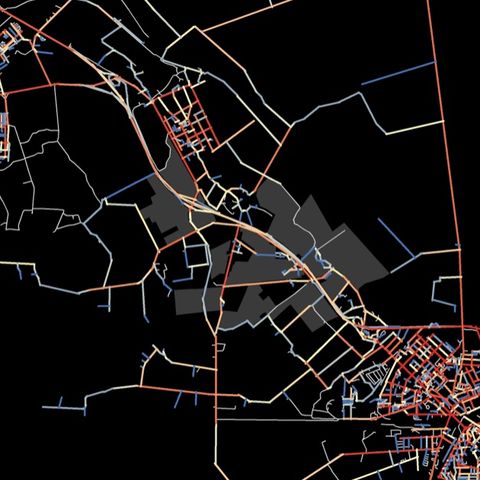
PlanningWe made:
AnalysesScale:
A district or a siteFor:
Developers, companies and practices
1
Edise Concept Plan
Four development scenarios for a former nursery site near Jõhvi keep density low: buildings would cover 4.8–20.5% of its 238,823 m² of buildable land.
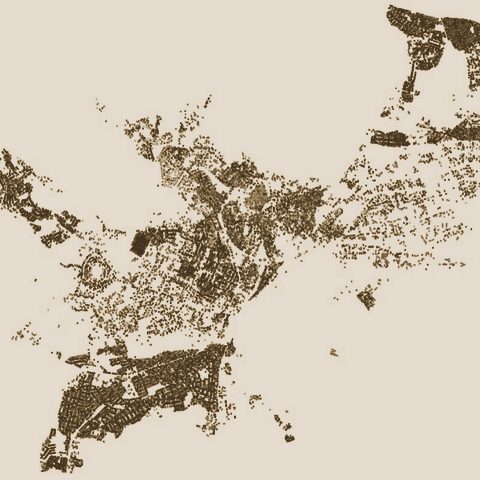
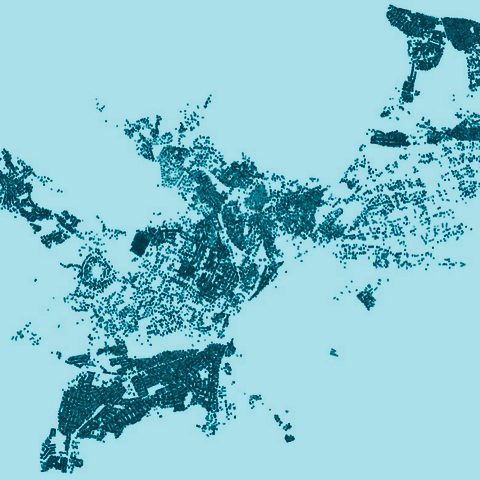
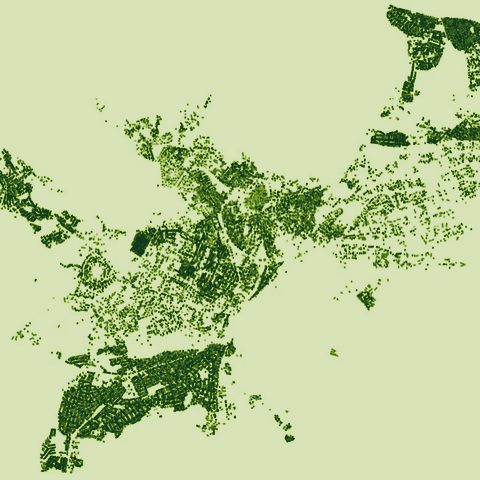
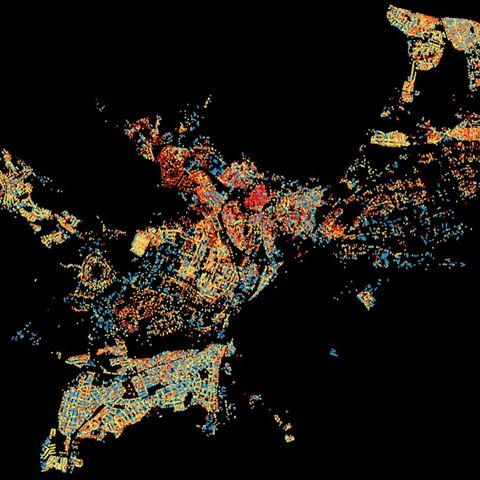
PlanningWe made:
AnalysesScale:
A whole cityFor:
Universities, culture and our own research
none
Tallinn interface map
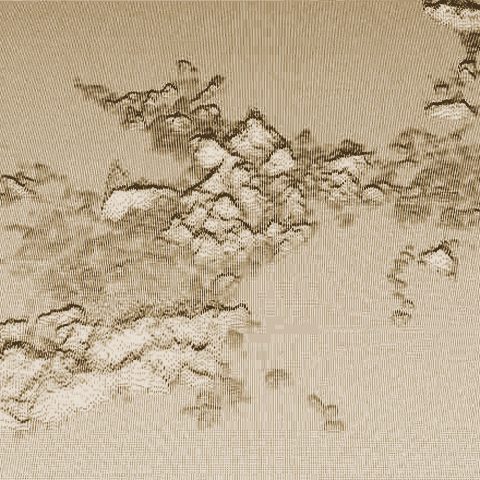
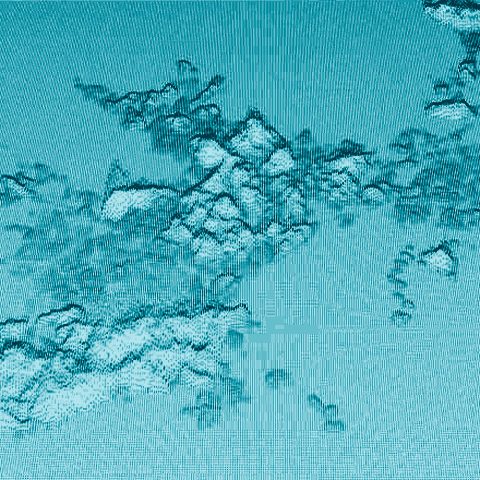
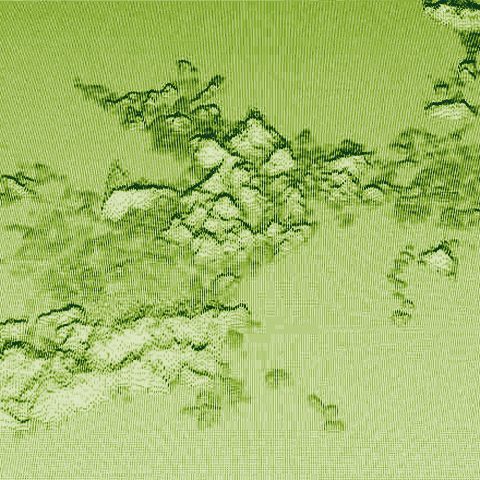
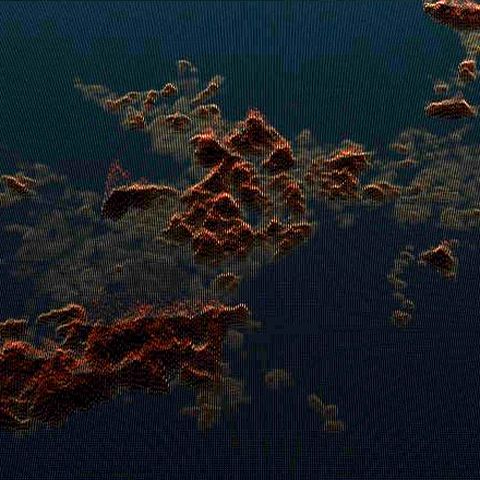
MobilityWe made:
AnalysesScale:
A whole cityFor:
Universities, culture and our own research
none
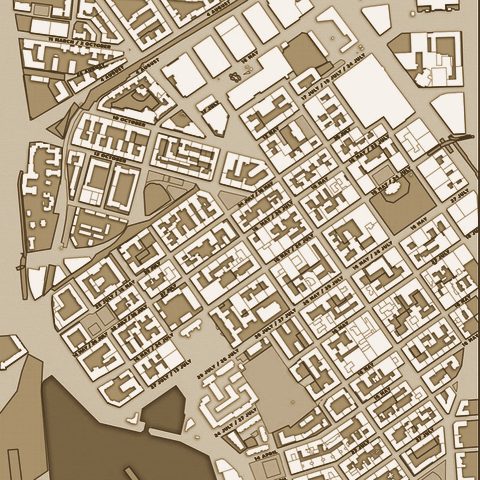
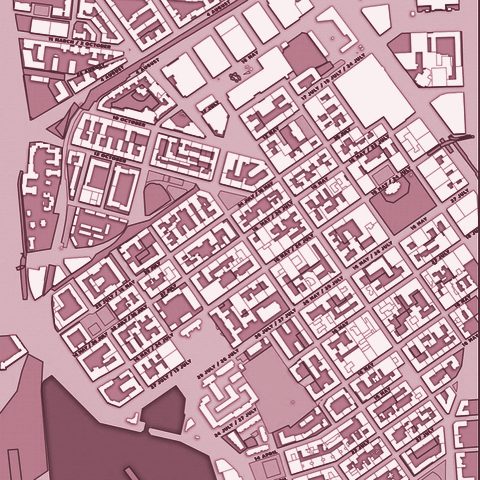
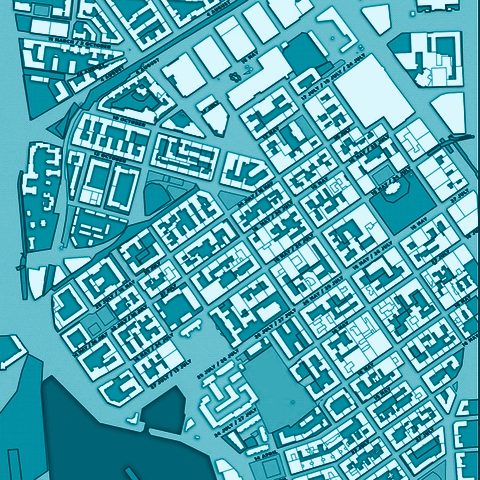
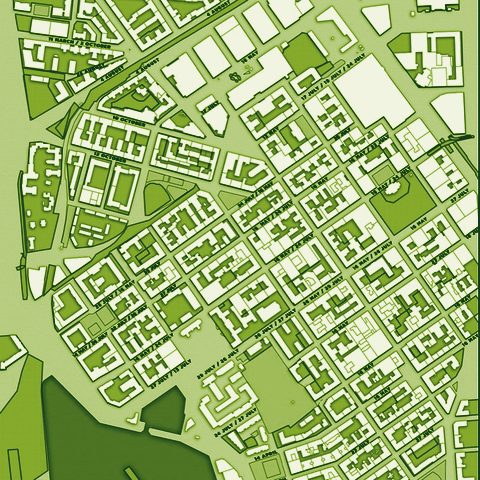
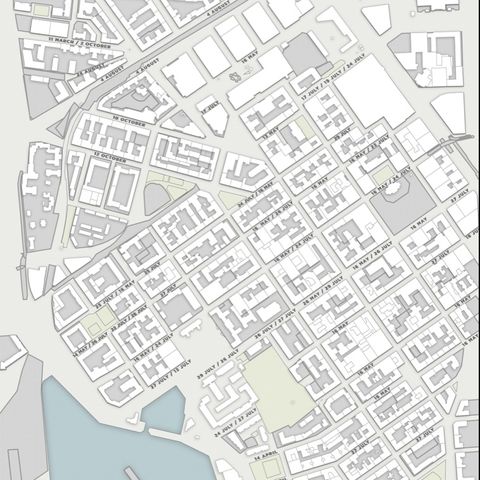
Tallinn pedestrian centrality maps
Public space and city lifeWe made:
AnalysesScale:
A whole cityFor:
Universities, culture and our own research
none
Helsinki Henge
MobilityWe made:
AnalysesScale:
A whole cityFor:
Universities, culture and our own research
none
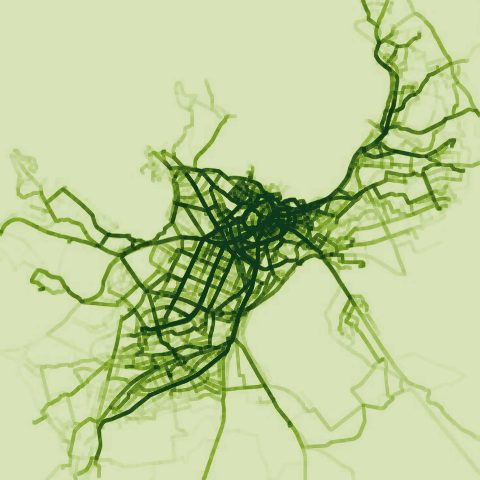
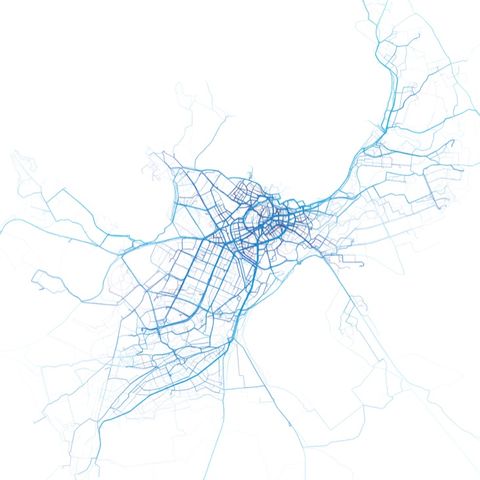
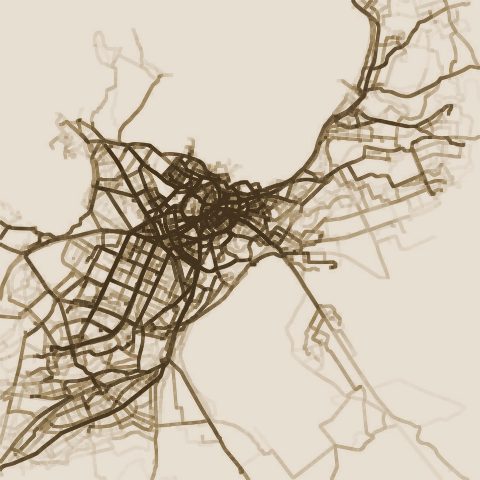
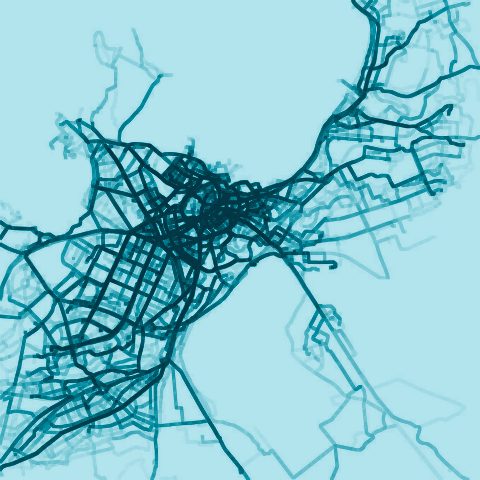
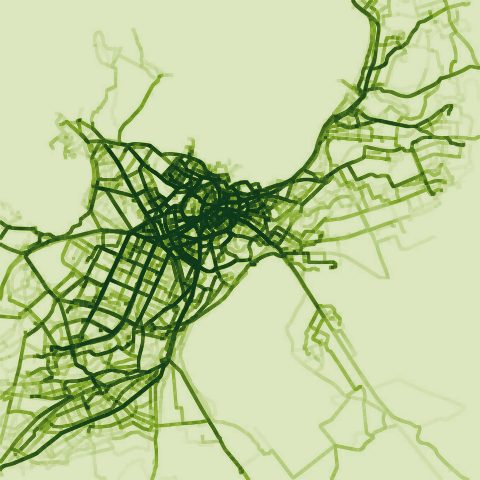
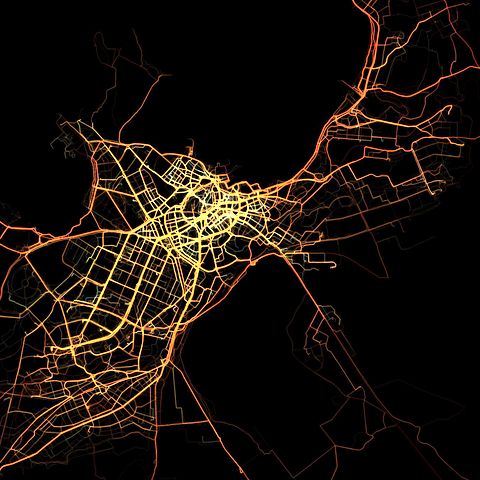
Tallinn cycling patterns
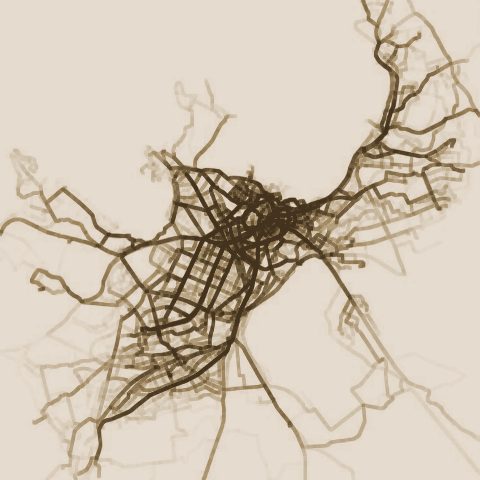
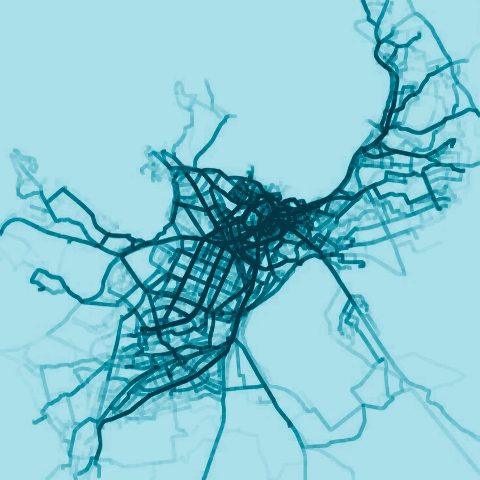
SPIN Unit’s own 2012 map of the routes cyclists rode across Tallinn.